Skip to content
DataMiner DoJo

More results...

Generic selectors
Exact matches only
Search in title
Search in content
Post Type Selectors
Search in posts
Search in pages
Search in posts
Search in pages
Log in
Menu
  • Updates & Insights
  • Questions
  • Learning
    • E-learning Courses
    • Empower Replay: Limited Edition
    • Tutorials
    • Open Classroom Training
    • Certification
      • DataMiner Fundamentals
      • DataMiner Configurator
      • DataMiner Automation
      • Scripts & Connectors Developer: HTTP Basics
      • Scripts & Connectors Developer: SNMP Basics
      • Visual Overview – Level 1
      • Verify a certificate
    • Video Library
    • Books We Like
    • >> Go to DataMiner Docs
  • Expert Center
    • Solutions & Use Cases
      • Solutions
      • Use Case Library
    • Markets & Industries
      • Media production
      • Government & defense
      • Content distribution
      • Service providers
      • Partners
      • OSS/BSS
    • Agile
      • Agile Webspace
      • Everything Agile
        • The Agile Manifesto
        • Best Practices
        • Retro Recipes
      • Methodologies
        • The Scrum Framework
        • Kanban
        • Extreme Programming
      • Roles
        • The Product Owner
        • The Agile Coach
        • The Quality & UX Coach (QX)
    • DataMiner DevOps Professional Program
      • About the DevOps Program
      • DataMiner DevOps Support
  • Downloads
  • More
    • DataMiner Releases & Updates
    • Feature Suggestions
    • Climb the leaderboard!
    • Swag Shop
    • Contact
    • Global Feedback Survey
  • PARTNERS
    • All Partners
    • Technology Partners
    • Strategic Partner Program
    • Deal Registration
  • >> Go to dataminer.services

The total total number of errors for the channels on chart

Solved607 views25th January 2024
0
Jaroslaw Burtny [DevOps Advocate]678 23rd January 2024 0 Comments

Hi ALL.

I can add up the total number of errors for the channels and display them on this chart ?

Should I sum two queries and how to do it ? . 

One thing I have is the number of CC errors for channels in 24 hours, and how to add total information for all CC errors , how to sum them up?

Big Thanks for help.

Br.

Jarek

Marieke Goethals [SLC] [DevOps Catalyst] Selected answer as best 25th January 2024

1 Answer

  • Active
  • Voted
  • Newest
  • Oldest
2
Ward Haeck [SLC] [DevOps Enabler]3.52K Posted 23rd January 2024 5 Comments

Hi Jarek,

To calculate the total number of errors you can use the Aggregate operator.

For example, in the image I'm using the aggregate operator to calculate the sum of all Egress bitrates of my interfaces:

Does this work for your use-case?

Best regards, Ward

Docs: https://docs.dataminer.services/user-guide/Advanced_Modules/Dashboards_and_Low_Code_Apps/GQI/Query_Operators/GQI_Aggregate.html

Marieke Goethals [SLC] [DevOps Catalyst] Selected answer as best 25th January 2024
Jaroslaw Burtny [DevOps Advocate] commented 23rd January 2024

Hi Ward.
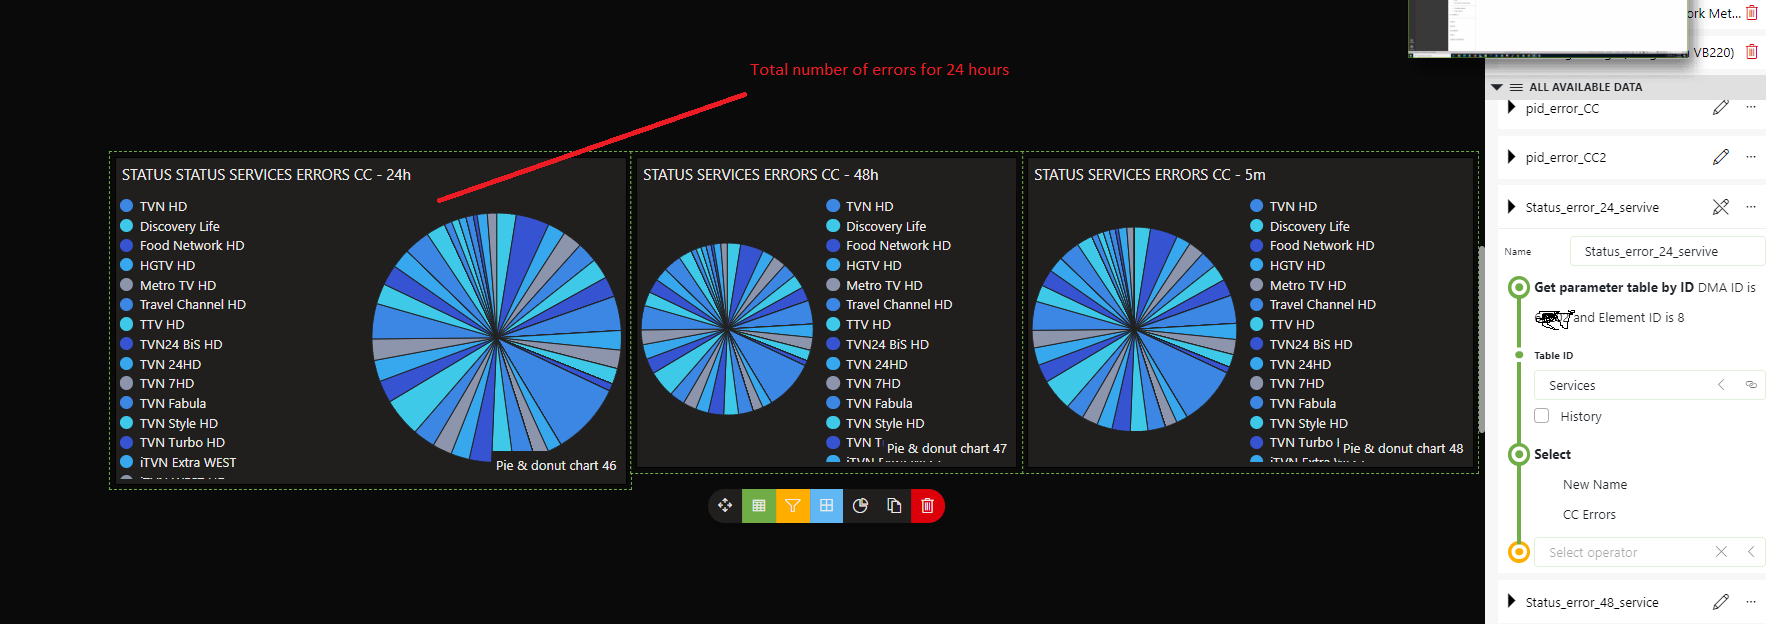
Can I join these two queries and show in one chart, i.e
number of CC errors for channels and number of total errors ?

Jarek

Ward Haeck [SLC] [DevOps Enabler] commented 23rd January 2024

Why do you want to show them both in one pie-chart?
As far as I understand currectly, you want to have the number of errors per channel in a pie chart and also want to visualize the total number of errors (across all channels) in the same pie chart? If that’s the case, the full pie (= all segments together) should already be the same as the number of all errors. Best regards, Ward

Jaroslaw Burtny [DevOps Advocate] commented 23rd January 2024

Yes, But I can’t do that on one chart 🙁
I don’t know how to combine it …

Jarek

Ward Haeck [SLC] [DevOps Enabler] commented 24th January 2024

Hi Jarek, It, unfortunately, won’t be possible to combine both metrics in the one pie chart.

What you could is calculate the total in a seperate query and visualize that in a state component, for example. Than you have a clear indication what the total number of errors is on your dashboard. If you then want to identify what channel is responsible for the most errors, you can inspect the pie chart. Would this work for you? Best regards, Ward

Jaroslaw Burtny [DevOps Advocate] commented 24th January 2024

Hi Ward.
Yes, I understood.
Thanks for the help 🙂
Br.
Jarek

You are viewing 1 out of 1 answers, click here to view all answers.
Please login to be able to comment or post an answer.

My DevOps rank

DevOps Members get more insights on their profile page.

My user earnings

0 Dojo credits

Spend your credits in our swag shop.

0 Reputation points

Boost your reputation, climb the leaderboard.

Promo banner DataMiner DevOps Professiona Program
DataMiner Integration Studio (DIS)
Empower Katas
Privacy Policy • Terms & Conditions • Contact

© 2025 Skyline Communications. All rights reserved.

DOJO Q&A widget

Can't find what you need?

? Explore the Q&A DataMiner Docs

[ Placeholder content for popup link ] WordPress Download Manager - Best Download Management Plugin