Skip to content
DataMiner DoJo

More results...

Generic selectors
Exact matches only
Search in title
Search in content
Post Type Selectors
Search in posts
Search in pages
Search in posts
Search in pages
Log in
Menu
  • Blog
  • Questions
  • Learning
    • E-learning Courses
    • Empower Replay: Limited Edition
    • Tutorials
    • Open Classroom Training
    • Certification
      • DataMiner Fundamentals
      • DataMiner Configurator
      • DataMiner Automation
      • Scripts & Connectors Developer: HTTP Basics
      • Scripts & Connectors Developer: SNMP Basics
      • Visual Overview – Level 1
      • Verify a certificate
    • Video Library
    • Books We Like
    • >> Go to DataMiner Docs
  • Expert Center
    • Solutions & Use Cases
      • Solutions
      • Use Case Library
    • Markets & Industries
      • Media production
      • Government & defense
      • Content distribution
      • Service providers
      • Partners
      • OSS/BSS
    • DataMiner Insights
      • Security
      • System Architecture
      • DataMiner Releases & Updates
    • Agile
      • Agile Webspace
      • Everything Agile
        • The Agile Manifesto
        • Best Practices
        • Retro Recipes
      • Methodologies
        • The Scrum Framework
        • Kanban
        • Extreme Programming
      • Roles
        • The Product Owner
        • The Agile Coach
        • The Quality & UX Coach (QX)
    • DataMiner DevOps Professional Program
  • Downloads
  • More
    • Feature Suggestions
    • Climb the leaderboard!
    • Swag Shop
    • Contact
      • General Inquiries
      • DataMiner DevOps Support
      • Commercial Requests
    • Global Feedback Survey
  • PARTNERS
    • All Partners
    • Technology Partners
    • Strategic Partner Program
    • Deal Registration
  • >> Go to dataminer.services

Spectrum Analyzer Parameter Controls disabled, how to debug it?

Solved1.21K views18th July 2023spectrum analyzer
0
Daniela Oliveira [SLC] [DevOps Advocate]356 28th September 2021 0 Comments

I’m working on a Spectrum Analyzer connector and the parameter controls are always disabled.
Doing a get parameter using client test tools I can see that the SA reserved parameters are configured as expected.
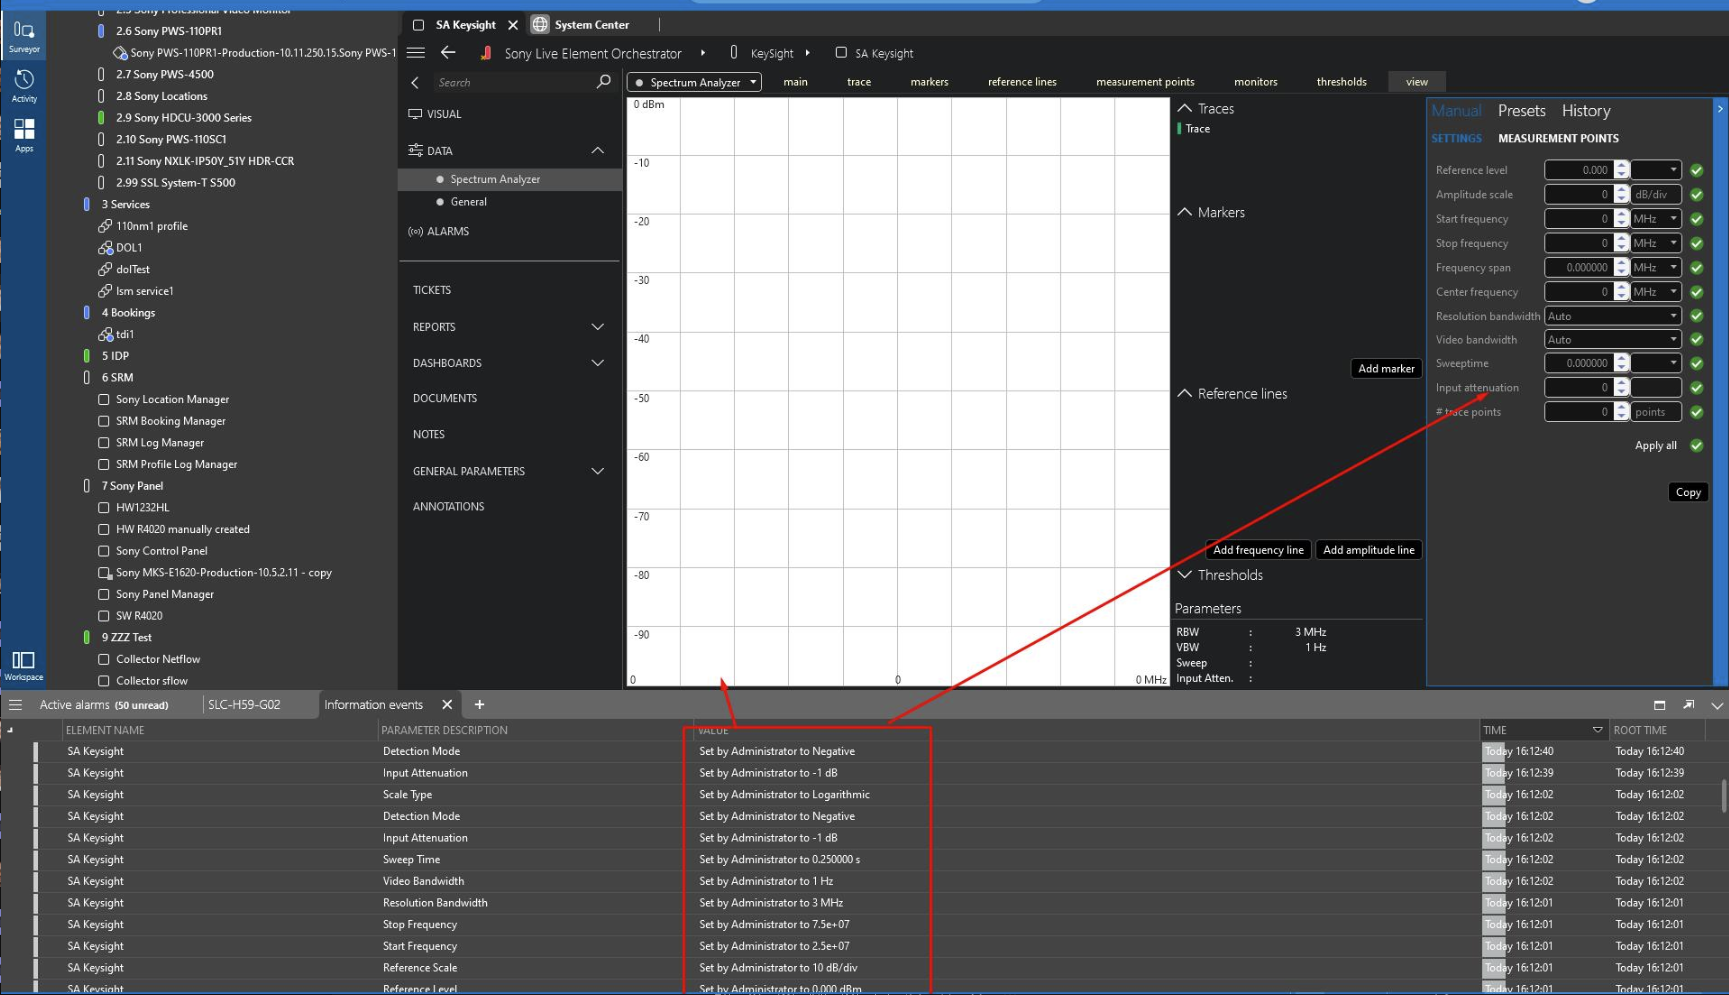
Also I can see some information events indicating that such parameters are configured, however these are not reflected in the parameter controls (please see image attached).

Maybe worth mentioning that i had the parameter controls enabled at first with the expected settings, but the trace data was not being parsed correctly. After fixing the trace data parsing the parameter controls are just disabled.

How can I debug it?

Marieke Goethals [SLC] [DevOps Catalyst] Selected answer as best 18th July 2023

2 Answers

  • Active
  • Voted
  • Newest
  • Oldest
1
Masschelein Karl [SLC]180 Posted 29th September 2021 0 Comments

Hello Daniela,

On the spectrum element card manual parameters are enabled when :

  • The matching write parameter is available in the driver :

64103;        // center frequency (write)

64104;        // frequency span (write)

64105;        // start frequency (write)

64106;        // stop frequency (write)

64109;        // input attenuation (write)

64110;        // reference level (write)

64111;        // reference scale (write)

64112;        // video bandwidth (write)

64114;        // resolution bandwidth (write)

64115;        // sweep time (write)

  • Only one trace is shown : current trace or one measurement point selected
  • Spectrum mode (Parameter ID : 64201) is Normal (1) or Prioritized (6) (same as normal without monitor executions)
  • At least one ParameterChangeEvent is received for trace param (Parameter ID : 64001)

The last two conditions can be checked using an slnetclient test tool.

Important to start a spectrum session is to send a loadpreset call, so the spectrum analyzer knows how to configure its manual settings. The spectrum element card does this automatically by loading the last session spectrum preset that gets saved automatically upon closing the spectrum element card.

Kind regards,

Karl

Marieke Goethals [SLC] [DevOps Catalyst] Selected answer as best 18th July 2023
0
Wouter Demuynck [SLC] [DevOps Advocate]5.93K Posted 29th September 2021 0 Comments

Additional to Karl’s info, the SLSpectrum.txt logfile is the place to be to debug most issues. When the loglevel has been increased to “Log Everything”, there will be a lot of logging about the client session (values being sent to the connector, values received from the connector, values forwarded to the client Cube session, errors, …)

Wouter Demuynck [SLC] [DevOps Advocate] Answered question 29th September 2021
Please login to be able to comment or post an answer.

My DevOps rank

DevOps Members get more insights on their profile page.

My user earnings

0 Dojo credits

Spend your credits in our swag shop.

0 Reputation points

Boost your reputation, climb the leaderboard.

Promo banner DataMiner DevOps Professiona Program
DataMiner Integration Studio (DIS)
Empower Katas
Privacy Policy • Terms & Conditions • Contact

© 2025 Skyline Communications. All rights reserved.

DOJO Q&A widget

Can't find what you need?

? Explore the Q&A DataMiner Docs