Hi Dojo,
We are currently working on an integration where we need to display spectrum traces from binary files.
In a standard spectrum analyzer implementation, DataMiner will be able to receive the traces directly from the device and display it in the spectrum UI. However, this integration is different. DataMiner will interact with a device that it is not a spectrum analyzer, but it can measure signals through a specific port and store the spectrum capture in a file available in a TFTP server.
The connector interacting with this device will be able to:
- Control the execution of the spectrum trace capture on the device
- Read the spectrum captures (binary files) from a TFTP server
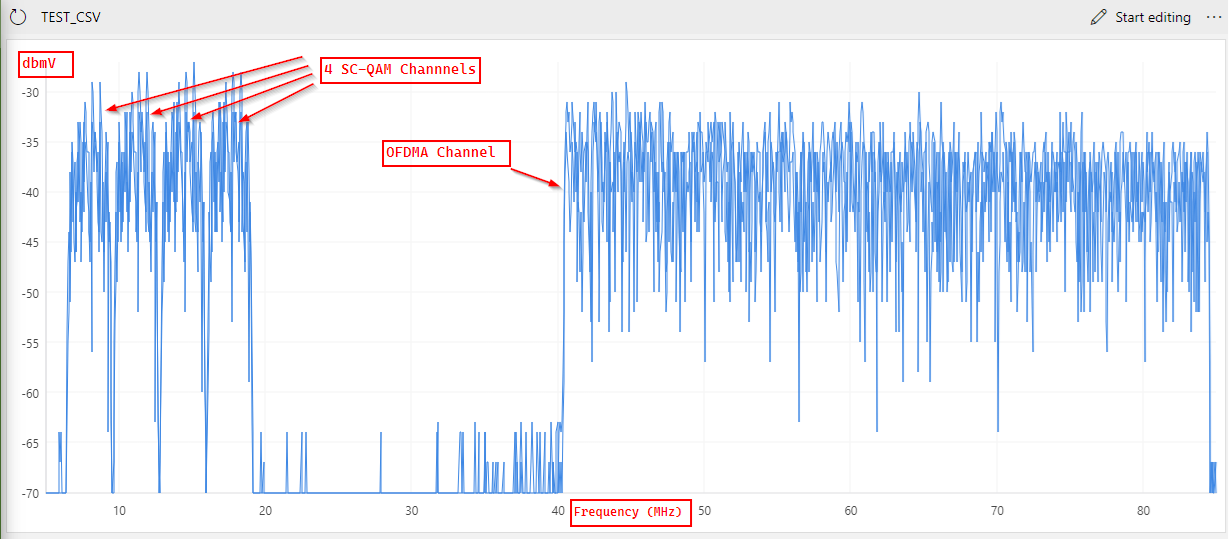
We have analyzed these binary files and successfully converted them to a CSV file format. Using a line chart, we can see the trace:

While we can visualize the trace using a line chart, line charts are not suitable for spectrum traces. We would like to utilize the spectrum UI to take advantage of its features (presets, markers, etc.).
I believe it should be possible to display traces in a spectrum UI, however the trace will not be continuously updated. Instead, it will represent a snapshot of a trace.
Questions:
- Is it possible to display traces from a file in a spectrum UI?
- If so, is there any limitation or constraint that we need to aware of?
Thanks.
As far as I know this would be no problem at all Miguel. If you make a spectrum element, it doesn't matter where the data is coming from, as long as it is pushed into the standard trace parameter it will be available on the UI. And indeed, it will be a static trace for most of the time, unless you reload the data from your TFTP server.
Hi Ben,
Thanks for the confirmation!