Hi Dojo,
While checking CUBE logging I've found a time measurement in ms: it seems to take more than 15s to connect to the SLNet service on the DMA - if so, any hints on how I can possibly shorten this time?

Ping time is well under 200ms:

Thanks
#EDIT# adding more screenshots (only removing IP details)
1. This shows the client-server connection takes longer than 20s,
despite a minimal (almost) null latency at network layer (18ms for the RTT):
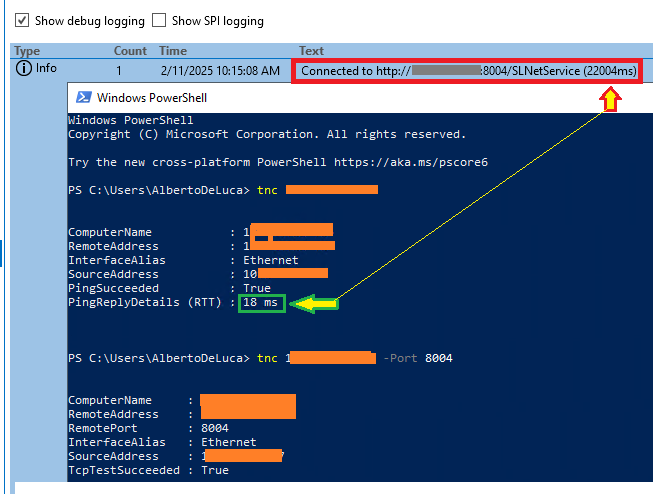
2. This has the "debug" lines as suggested in the first answer.
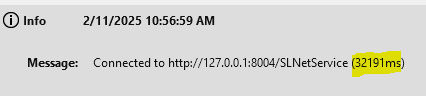
At times, we experience 30+ seconds even when launching CUBE directly on local host:
Hi Alberto,
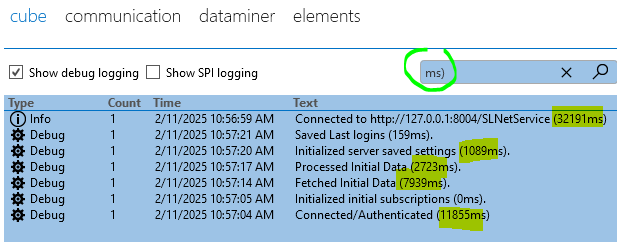
By enabling the checkbox on top '[x] Show debug logging', you can see more details. Here's a screenshot from my connection and I highlighted the key parts:
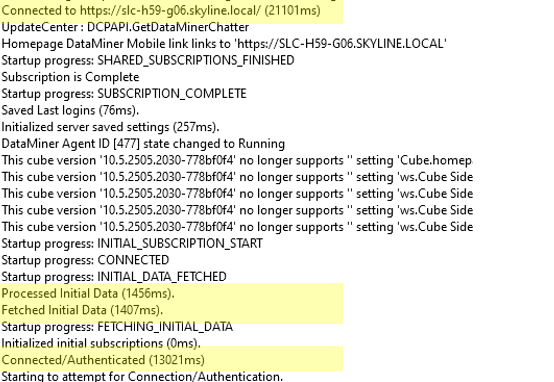
The bottom part (in my case 13sec) is the time it takes to authenticate (includes protobuf initialization in case that's enabled (by default it is)).
Then I have 1.4 sec to retrieve some of the initial data (like the views, elements, etc)
And another 1.4 sec to process that.
In between there is also some UI initialization, potentially extra initial requests and I end up at 21sec to connect.
Can you share the measures of your connection? Then we can see where the 15sec go into.
--- Addendum slcientclienttest - noprotofuf - see comments vv --
Details added in the edit – I'm quite surprised to see a huge delay even when opening CUBE on the local host – any hint on how to achieve a faster SLNet connection?
Thanks
Thx for sharing more details Alberto.
'Connecting' includes more or less three parts:
1. Authentication
2. Requesting initial data
3. Initializing the UI (processing the initial data, initializing model layer, generating the UI, …)
We are aware that the Authentication part includes a 'protobuf initialization' which takes a significant part and that can be prevented via a setting. That results in slower communication on some types of messages (mainly SRM related). We can experiment with that on your staging to see how much you like that.
The Initial data upon connecting can be quite extensive. It includes all your view info, your element info, service info, user settings, … The time includes serialization (server) and deserialization (client) of all the objects so it's definitely more than sending over the wire. We've done some small improvements in recent Cube version wrt interface data, so a recent Cube version can show some improvements here. What Cube version are you using?
The last part, the UI initialization, can depend on your initial open cards, alarm console tab pages, etc In your user settings you can for example configure to save your open cards, so that they are loaded again upon new connections. But you can also choose to start from a clean workspace. Same for alarm console tabpages, the ones based on active alarms are reopened in new connections.
Finally, a connection time from 15 to 35 seconds is rather common I believe (not claiming it's good and that we should not aim for better 😉 ). Better, faster, cheaper is what we all want to achieve, right?
I read that you are surprised to see this delay, which make me believe it used to be faster on your side… is that the case? Do you believe the connection was faster in a past version maybe?
Thanks for the thorough feedback, Pieter – much appreciated!
No SRM in this environment, so if any settings can be recommended to expedite the load-up of the CUBE UI, I'd be keen to experiment these in staging with our support squad.
Version wise, currently using the following:
—————
Server version : 10.3.0.0-13184 (10.3.0 CU5)
Client version : 10.3.2243.13316-c0f46547
Launcher version : 10.4.2413.720-1c47f2f3
—————
I get it now, so depending on the saved cards in my last session I could experience longer or shorter times to initialize my CUBE connection.
I was surprised at first as 15s looks quite long, but indeed you were getting 20s and later on it took me 30s to establish CUBE connection: the reason was also in the fact that when using the "Monitoring" app from the "cloud-connected" DMA, I land on the UI in less than 2-3s – then the data loading keeps happening in the background.
My first test above was with CUBE desktop app running on a client –> 15s;
My second check was with CUBE desktop app running locally on the DMA (127.0.0.1) –>30s
So maybe that DMA has some more cards cached locally for my user.
Hi Alberto,
In that sense the Monitoring app is indeed much more lightweight (and also limited in capabilities) and there are indeed opportunities in Cube to improve in that sense.
I have two suggestions for you that can impact the connection time at your system.
1. Use a more recent Cube version (preferably the latest, but 10.4.12 or higher should already have some impact, depending on the type of elements you have) – (When having internet access on your clients, by default, you should be updated automatically to the latest Cube version)
2. Experiment with disabling protobuf. Warning, this will give a faster authentication step, but can result in some slower data loading at some point (mainly SRM related data).
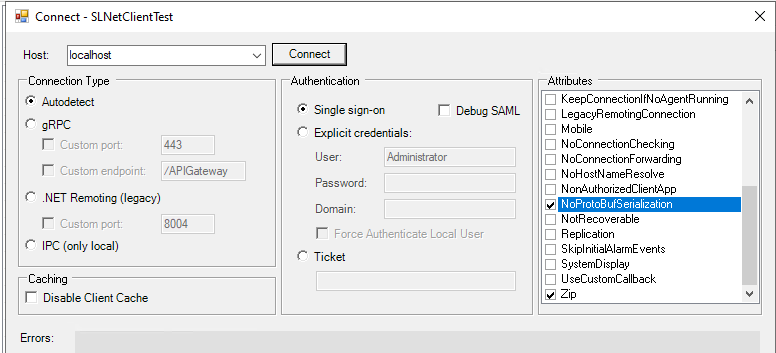
The easiest experiment you can do here is connecting via slnetclienttest.exe. Not sure if you are familiar with that test client? You can run it on every agent via the DataMiner systray icon context menu > Launch > Tools > Client test.
In the connect window (I'll add a screenshot in my main reply), you find a list of attributes on the right hand side. One of the attributes is 'NoProBufSerialization'. If you connect with or without that option, you should be able to see the difference. Be aware that you'll have to restart the test tool to see an effect, because it's only the first time that you'll notice the delay with protobufSerialization. If you want to disable the protobufserialization for all connections (so also Cube), you can use this softlaunchoption: <ProtoBufSerialization>false</ProtoBufSerialization> (https://docs.dataminer.services/user-guide/Reference/Soft-launch_options/SoftLaunchOptions.html). If you can try this on your staging system and share the results, we can discuss the next steps.
Thanks, Pieter
Will edit the question to add more info from the debug logging
What I can see is that even in your case it takes longer than 20s to connect:
is that expected?