Hi Dojo - question for all the SL-processes experts - 50 points for a good answer (;
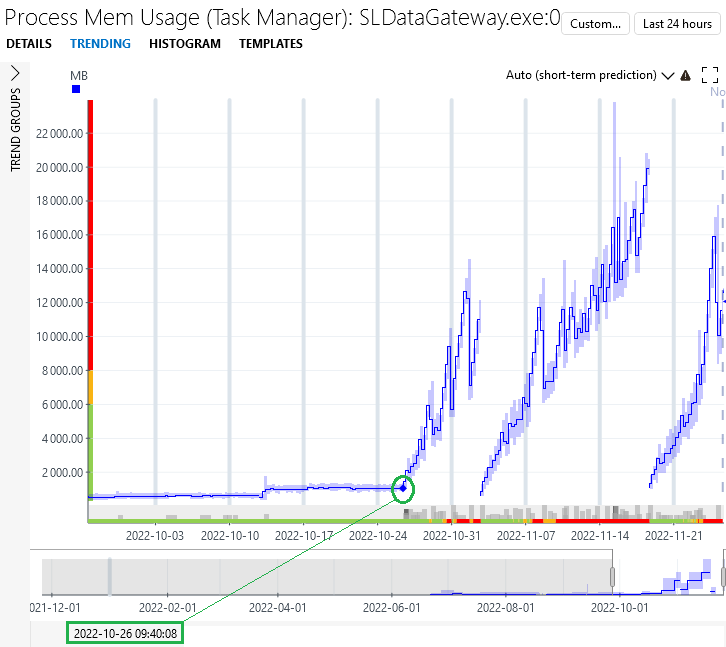
We spotted a memory leak on SLDataGateway in 10.2.4.0-11608: the memory consumption can run up to 20GB (sometimes even beyond).
Our squad has already confirmed the issue is addressed in 10.2.10 - plans for the upgrade are already shared - but regardless of the fix, I'm curious about how this started - what could be the root cause of this behaviour?
It started on a few servers on the same date - could there be any possible relation with NIC teaming settings on the servers (e.g. increased MTU size)? Any relation to be checked with SLElement (or SLProtocol)?
If not, what else could we check to mitigate the impact until the upgrade is performed?

The behaviour was first observed last month - the process was using less than 1GB before:
Thanks
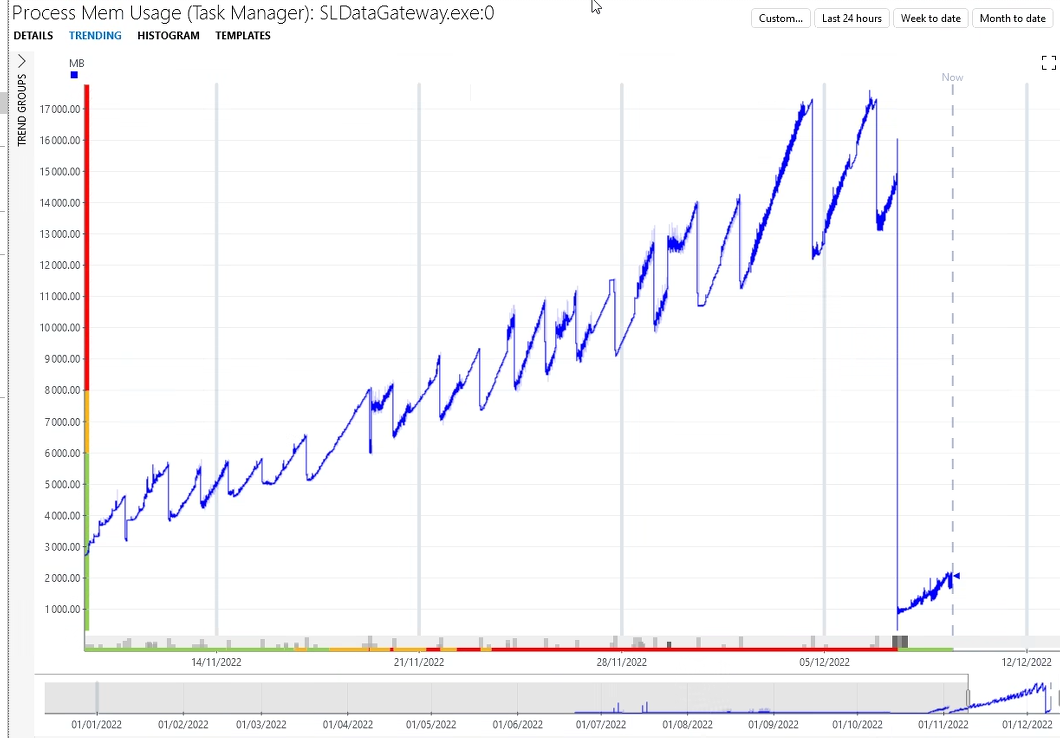
Sharing the memory trend for SLDataGateway after the upgrade to 10.2.10
The slope seems more tolerable, yet it's still present:

Hi Alberto, is it possible that you are using CassandraCluster (see DB.Xml for Cassandra configuration)? In that case the saw pattern memory leak will be fixed from 10.3.1 onwards.
Thanks for the hint Jens – no Cassandra cluster in this environment.
We run a local Cassandra DB on each agent – any additional check we could perform?
Not sure if this still applies – but any difference in the process between 9.0 & 10 might help:
https://community.dataminer.services/troubleshooting-sldatagateway/?hilite=cpu+average+load