Hi,
I’m looking for a 1 pager report to detail all the services under a view with the parameters and values for each of these services. Is there a quick and easy way to do this via the standard Dashboard/Report module?
Hi Vig,
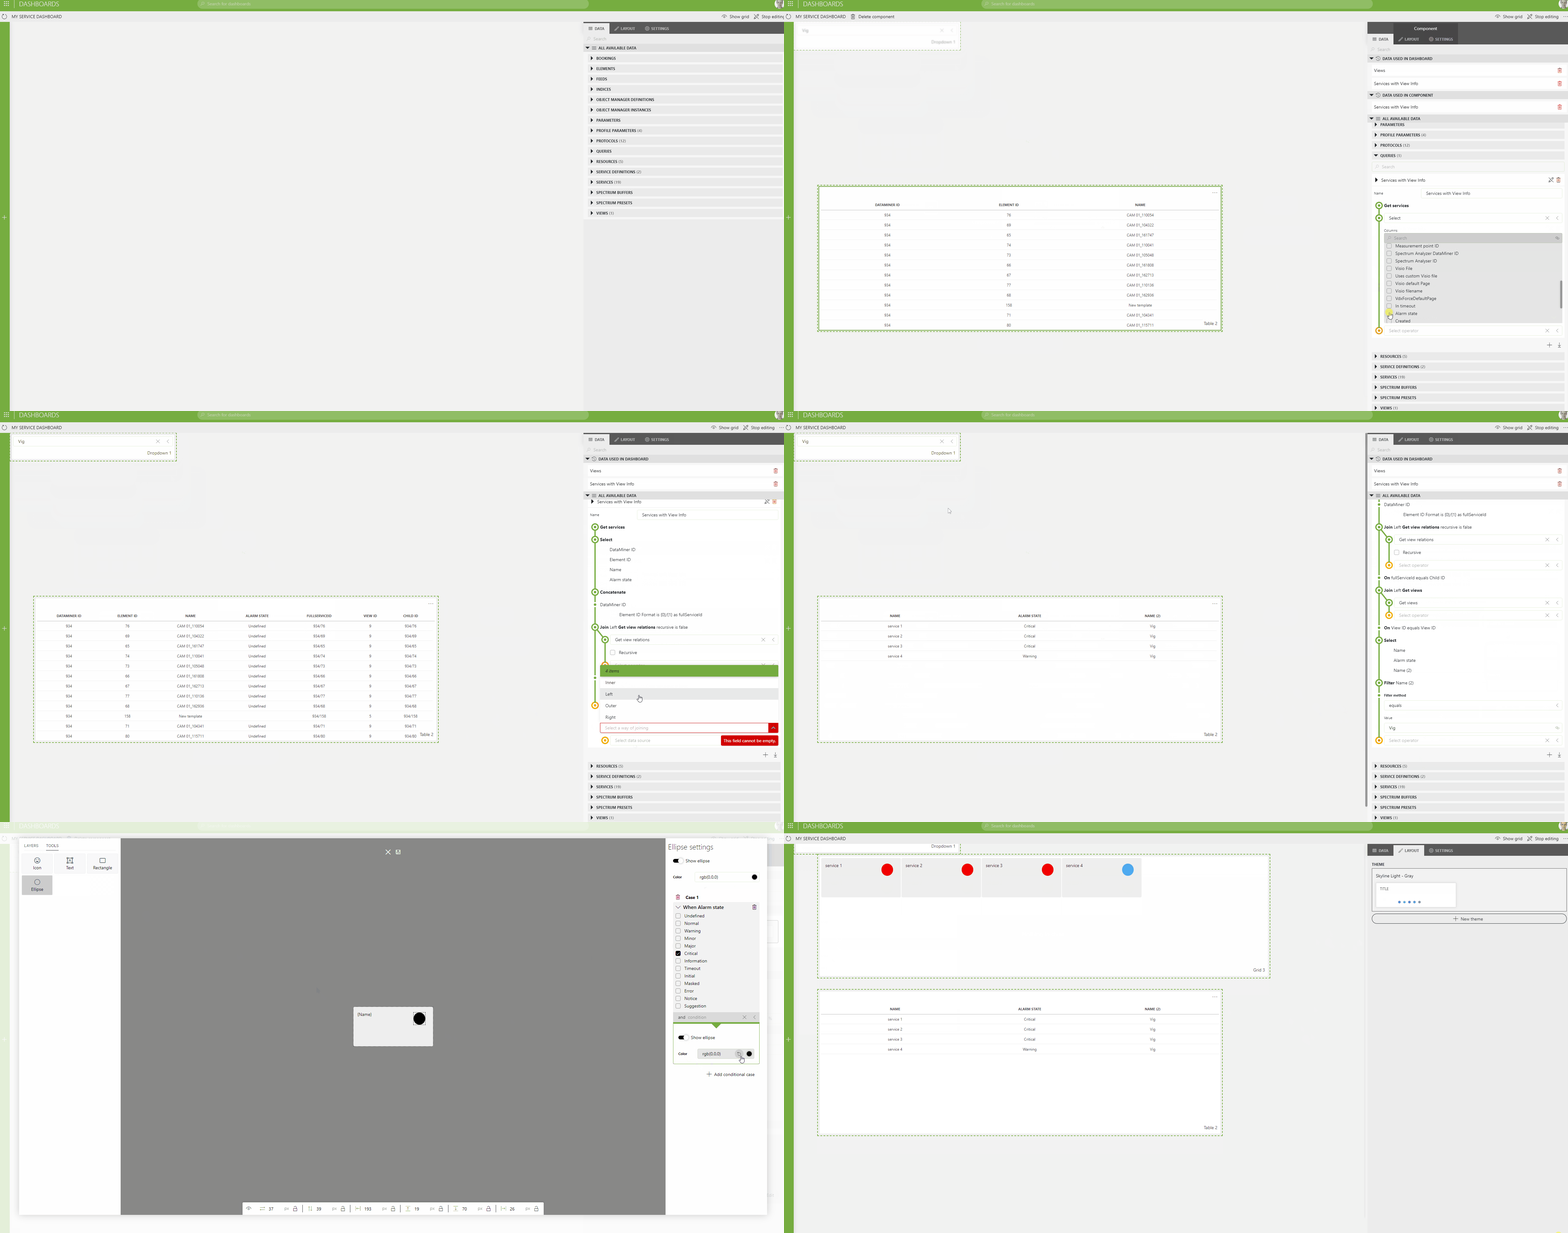
I created a quick screen recording of how you could create a dynamic dashboard for your services, filtered on view.
Note that this dashboard is dependent on the ReportsAndDashboardsDynamicVisuals softlaunch option.

Note, that the table at the bottom is not mandatory, I’ve just added it on the screen so it’s visible what happens with the data as I’m manipulating the GQI query.
Thanx Ive, I will give this a go
If you are cloud connected, you can deploy the Services Overview dashboard to your system to give you a good baseline to start with.
Together with our course on Dashboards you should be able to get something going.
We are all about empowering you to set up the solutions YOU like, so hopefully these resources help! Do also check out our DataMiner DevOps Professional program to really get the ball rolling!
Hi Toon, unfortunately we are not cloud connected. We want to be able to do this locally. I’m playing around with the query option but it doesnt give me the details I need. Is there more info on how about doing this?
If you could edit your question with what you already have (and let me know through the comments), let us know where you are stuck and we’d love to help you further. Keep in mind that this forum also serves as a knowledge base for answering common questions. Therefore it’s best to address the hurdles people encounter rather than creating full solutions (which will be a hard thing to achieve in this forum even if we did want to).
the gif might be a bit small when looking at this inline, but you can right-click the gif and choose open in a new tab, to get a full-screen view.