Hi ALL.
Why can’t I display TRENDS for querying the table but for taken for the parameter table, I can ?
Is there anything I can change in the settings to do this?
The screen from QUERIES to Service table

The screen from table parameters SERVICE as below:

Where could the problem be?
Big tahnks for help.
Br.
Jarek
Hi Jarek,
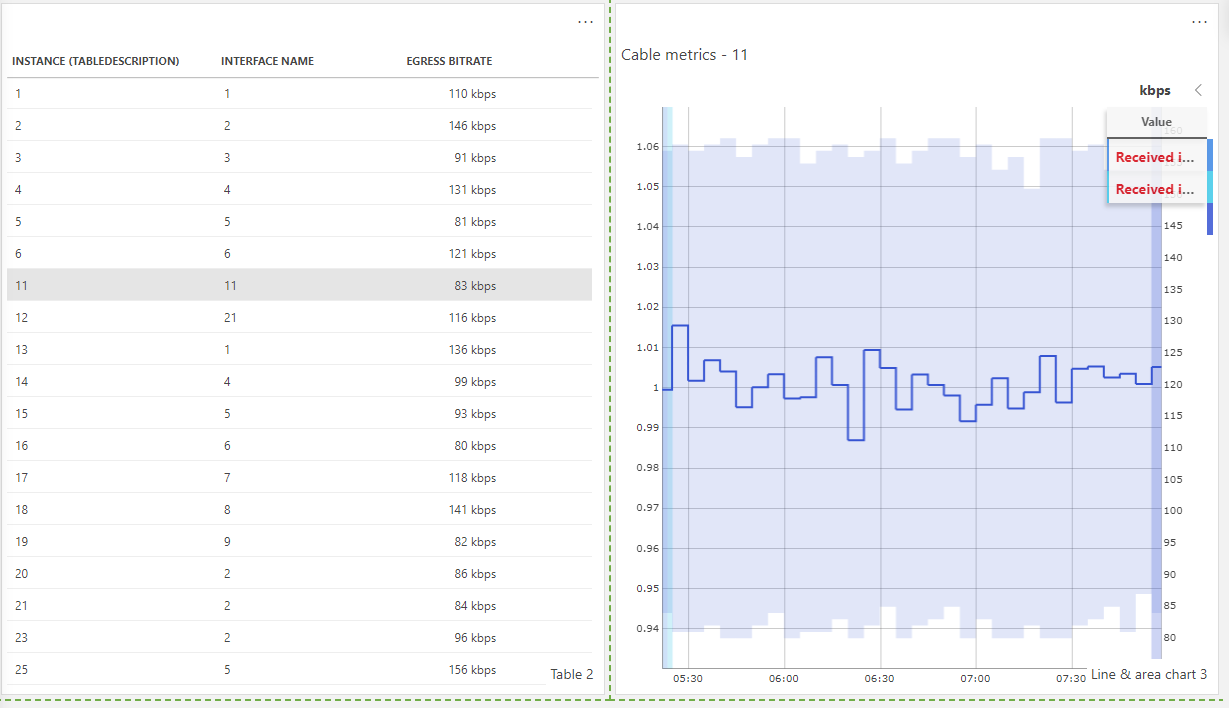
As Robin suggests you can feed the parameter of the selected row to a line chart:
- Add a line & area chart to your dashboard
- Select a row in your table
- Go to FEEDS and select your table
- Drag Parameters on the Line & Area chart
The end result will look something like this:

Hope this helps!
Best regards, Ward
Hi Jarek.
The simple answer is it is not possible to do this in the GQI Table.
You could however feed the selected row of the GQI table to a parameter table and in this way keep the ability to click open its graph.
Another posibility is to feed the selected row to a line chart.
Hi Robin.
Can you show me how to do this as this is my first step?
Big tahnks for help.
Br.
Jarek
If you are working in a low code app, you could also try to use on click actions to, for example, navigate to the monitoring app on click of a table cell. More info on further styling and adding additional functionality to your table can be found here:
https://docs.dataminer.services/user-guide/Advanced_Modules/Dashboards_and_Low_Code_Apps/Low_Code_Apps/Tutorials/Tutorial_Apps_Style_A_Table.html