Dear DoJo masters,
End-user have an Agent with 32 Gb ECC Ram.
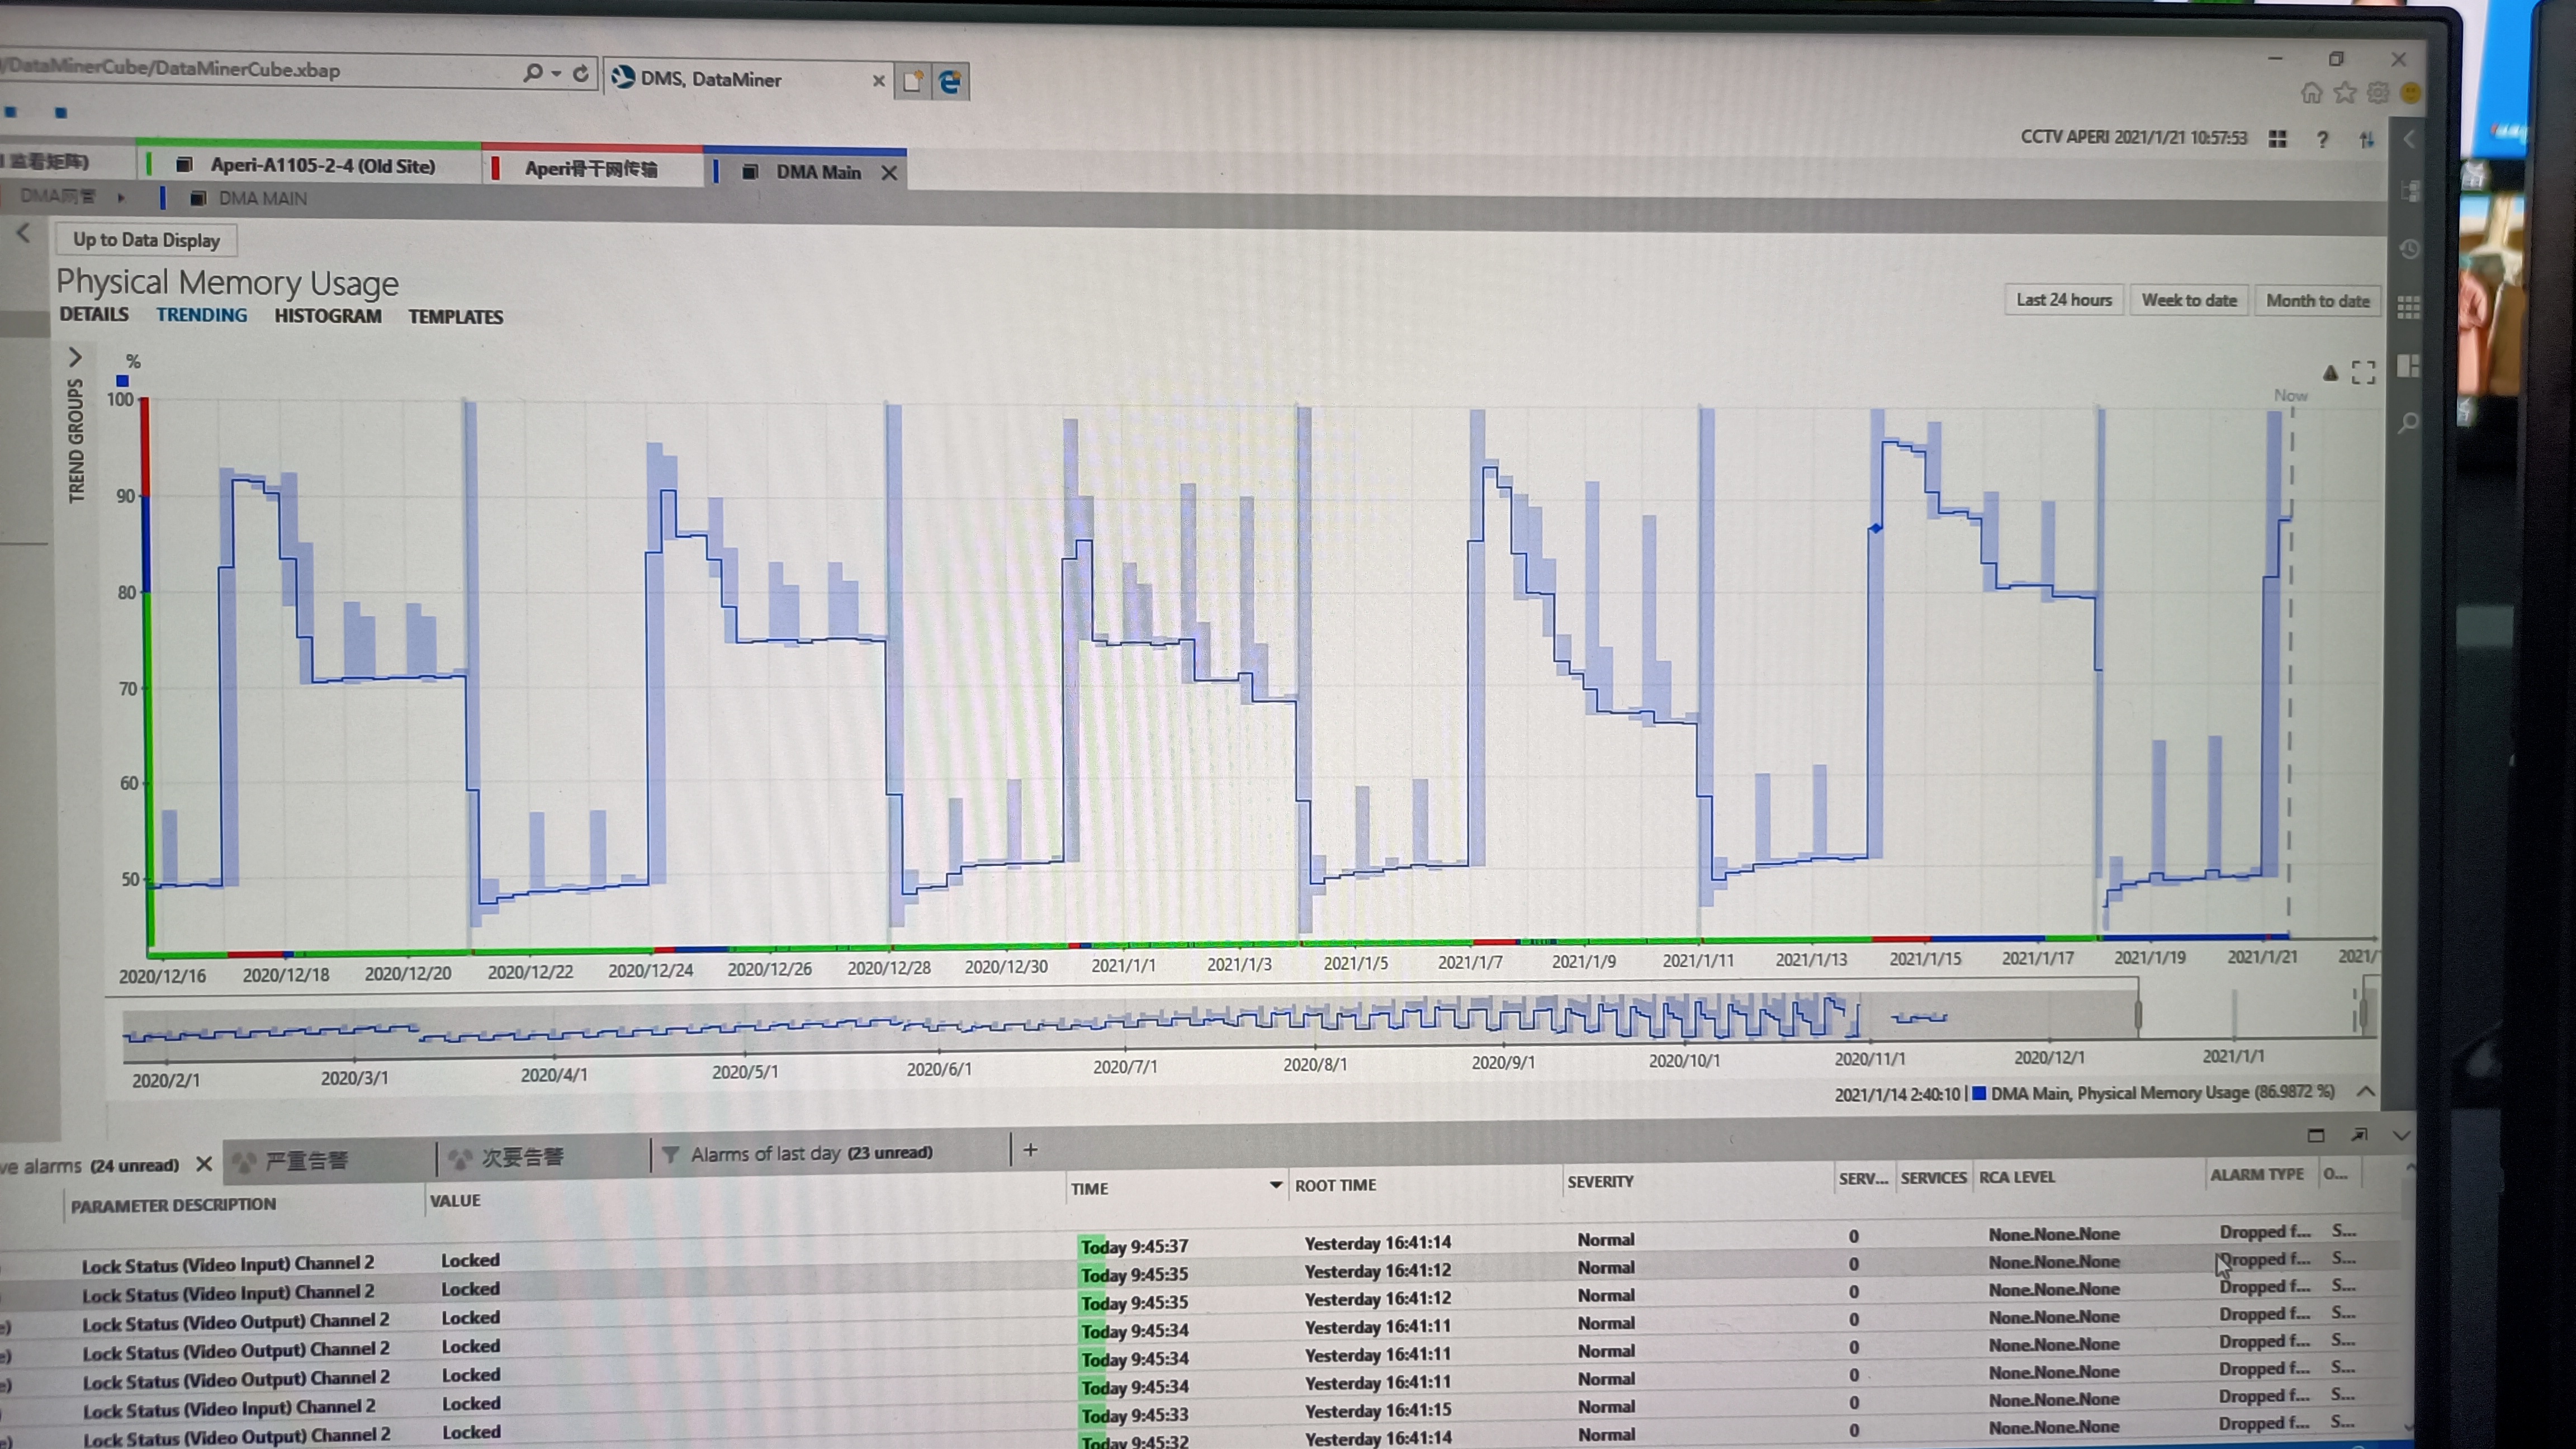
Every time Cassandra service starts running, Prunsrv.exe process shown physical memory utilization in OS TASK Manager is DIFFERENT from the utilization show on resource monitoring (OS built-in) & also, DMAGENT ms-platform monitoring, and the value shown on OS task manager is far less than DMA agent show value, and it actually trigger alarm everytime. why this could happen?
and the memory utilization is surge at 90%-99% could happen.
Apparently, there are no other processes which occupying those bandwidth as reflected in task manager.....which means 10-15Gb Physical memory usage is not shown on task manager....any similar experience?

Another thing is the pattern of Cassandra related memory surge is repeating with fix pattern along a 7-days week pattern, is it normal? are there any scheduled Cassandra self-initiated process built-in cassandra PKG?
does this pattern reflect any potnetial crisis?

I believe someone from the fabric product line once told me this:
The Cassandra process works as such that it will take up a bunch of memory by default, even if it's not using all of it, it will reserve this memory in case it's needed. Cassandra also takes heavy usage of page cache. Note that page cache isn't really occupied memory, you can read more about page cache with a simple web search.
However, it doesn't put a high priority on keeping the memory that is not actually allocated. So when the machine is running low on memory and other processes need it, cassandra will give up (part) of its reserved memory.
So in short, no, this is nothing to worry about.