Skip to content
DataMiner DoJo

More results...

Generic selectors
Exact matches only
Search in title
Search in content
Post Type Selectors
Search in posts
Search in pages
Search in posts
Search in pages
Log in
Menu
  • Updates & Insights
  • Questions
  • Learning
    • E-learning Courses
    • Empower Replay: Limited Edition
    • Tutorials
    • Open Classroom Training
    • Certification
      • DataMiner Fundamentals
      • DataMiner Configurator
      • DataMiner Automation
      • Scripts & Connectors Developer: HTTP Basics
      • Scripts & Connectors Developer: SNMP Basics
      • Visual Overview – Level 1
      • Verify a certificate
    • Video Library
    • Books We Like
    • >> Go to DataMiner Docs
  • Expert Center
    • Solutions & Use Cases
      • Solutions
      • Use Case Library
    • Markets & Industries
      • Media production
      • Government & defense
      • Content distribution
      • Service providers
      • Partners
      • OSS/BSS
    • Agile
      • Agile Webspace
      • Everything Agile
        • The Agile Manifesto
        • Best Practices
        • Retro Recipes
      • Methodologies
        • The Scrum Framework
        • Kanban
        • Extreme Programming
      • Roles
        • The Product Owner
        • The Agile Coach
        • The Quality & UX Coach (QX)
    • DataMiner DevOps Professional Program
      • About the DevOps Program
      • DataMiner DevOps Support
  • Downloads
  • More
    • DataMiner Releases & Updates
    • Feature Suggestions
    • Climb the leaderboard!
    • Swag Shop
    • Contact
    • Global Feedback Survey
  • PARTNERS
    • All Partners
    • Technology Partners
    • Strategic Partner Program
    • Deal Registration
  • >> Go to dataminer.services

Linux Platform SNMP

Solved960 views17th July 2023
2
Craig Humiston12 16th March 2021 0 Comments

Hello,

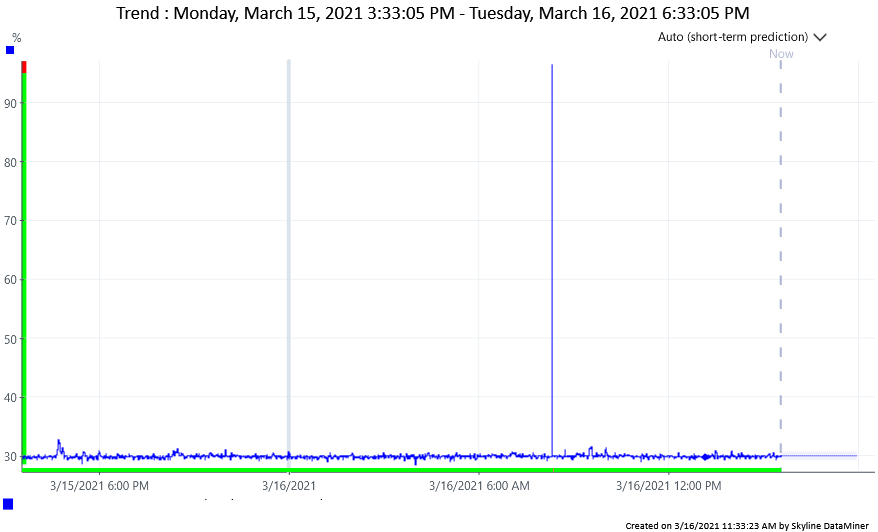
I am monitoring a VM with Linux Platform SNMP driver v 1.1.0.34 on a system running Skyline DataMiner (9.5.14.0-7731). We have recently received alerts for Total CPU Usage at 96 %. (alarm threshold 95%). These are spikes less than 2 minutes in time. The cpu monitor on the VM does not correlate and comes no where near 96%. It does show ‘spikes’ of about 35%. How is there such a discrepancy?

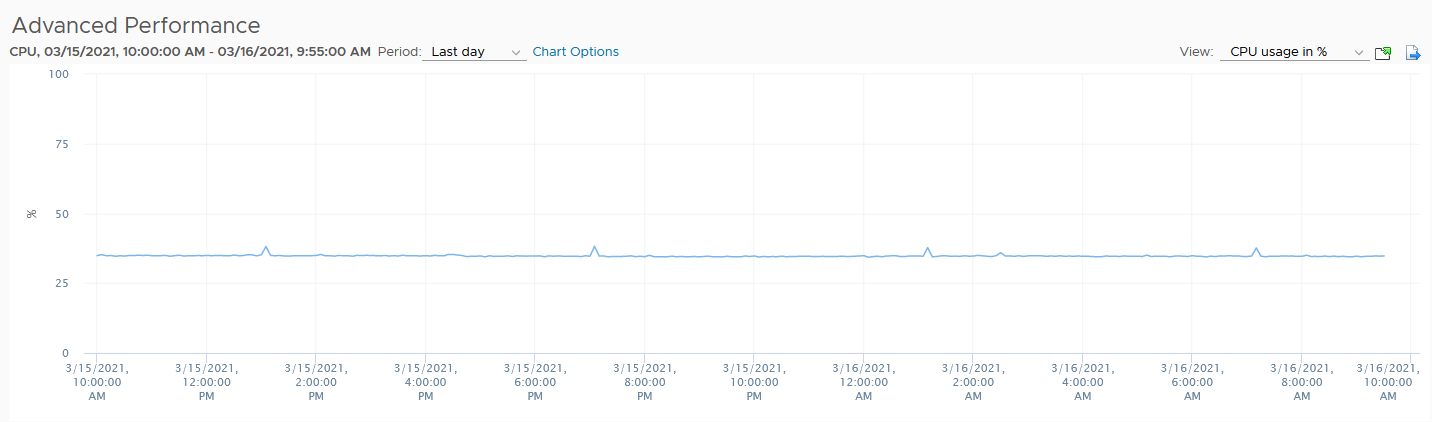
Thank You in advance,

Craig

Marieke Goethals [SLC] [DevOps Catalyst] Selected answer as best 17th July 2023

2 Answers

  • Active
  • Voted
  • Newest
  • Oldest
3
Ive Herreman [SLC] [DevOps Enabler]13.59K Posted 16th March 2021 2 Comments

Hi Craig,

From the release notes for the driver, I could see that some fixes have been made in the more recent driver versions for the calculation of the CPU usage.

Can you please use the protocol update center in the “protocols & templates” module to download the latest Linux Platform SNMP driver (version 1.1.1.8 at the moment of writing)?

The full set of release notes can be found in the driver catalog (direct link)

Marieke Goethals [SLC] [DevOps Catalyst] Selected answer as best 17th July 2023
Craig Humiston commented 17th March 2021

Hi Ive,
Thank You for your input. I checked the protocol update center, and see no update available for that driver on my account?

Ive Herreman [SLC] [DevOps Enabler] commented 17th March 2021

Hi Craig,

Let me follow-up internally and see if someone can install the latest version on your system.

0
Miguel Obregon [SLC] [DevOps Catalyst]19.12K Posted 16th March 2021 1 Comment

Hi Craig,

This looks like a driver issue. In order to further investigate, please could you let us know:

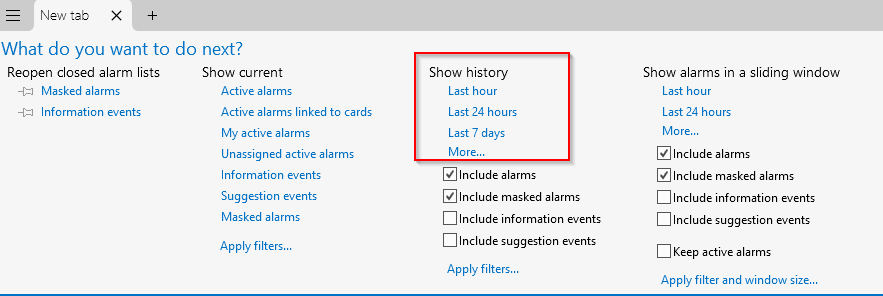
  • At the moment of spike, could you check in the alarm history if the element was in timeout? You could check the history by opening a new tab in the alarm console a selecting ‘Show History’:

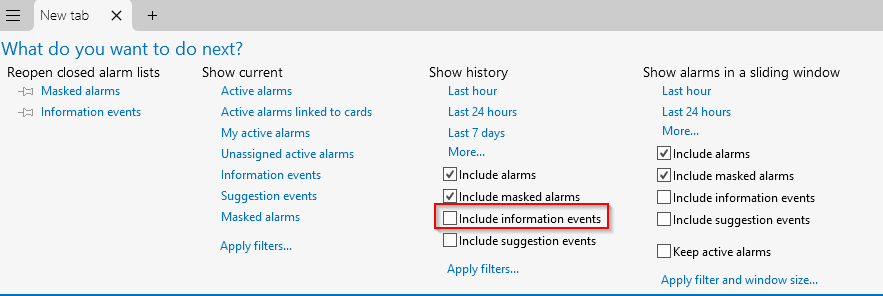
  • Could you check in the information events if there was an issue in the DMA (running this element) around the time of the spike?. You can include information events:

  • If you are monitoring another KPI (for example Physical Memory Usage), could you double check (using trend graph) if there was any spike or anomaly in this KPI?

Additional information about how to work with the alarm console can be found in the DataMiner Help – Working with the alarm console

Craig Humiston Posted new comment 17th March 2021
Craig Humiston commented 17th March 2021

Miguel,
Thank You for that detailed investigation. The element was not in time out and I was monitoring another KPI, idle time, which should have gone to 100-value, but didn’t.

Please login to be able to comment or post an answer.

My DevOps rank

DevOps Members get more insights on their profile page.

My user earnings

0 Dojo credits

Spend your credits in our swag shop.

0 Reputation points

Boost your reputation, climb the leaderboard.

Promo banner DataMiner DevOps Professiona Program
DataMiner Integration Studio (DIS)
Empower Katas
Privacy Policy • Terms & Conditions • Contact

© 2025 Skyline Communications. All rights reserved.

DOJO Q&A widget

Can't find what you need?

? Explore the Q&A DataMiner Docs