Hi guys,
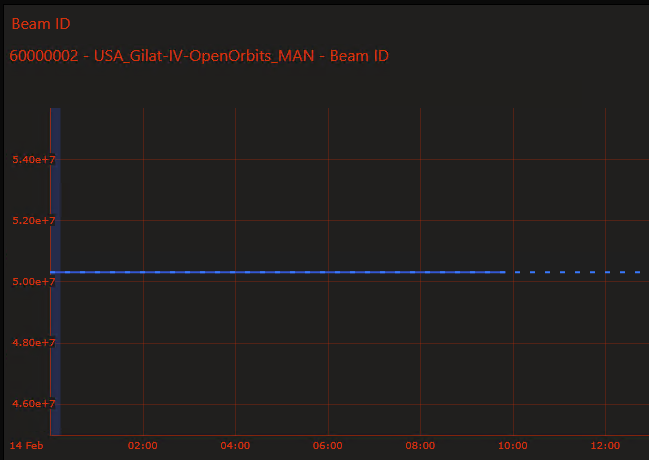
On a dashboard graph I want the option to have human readable values instead of scientific ones.
How can I achieve that ?
Thanks.
Daniel Lentoiu Selected answer as best
Hi Daniel,
I see that this question has been inactive for some time. Do you still need help with this? If not, could you select the answer (using the ✓ icon) to indicate that no further follow-up is needed?
I believe by default, this is down to the unit defined in the integrated API – in some cases, a transformation of the unit might be viable at protocol layer (that would achieve the result you want).
Subscribing to get more info – not aware if any dashboard or LCA can also operate the transformation on the page used to share the trend data with the users.