 Wout Mahieu
User info
| First name | Wout |
| Last name | Mahieu |
DevOps Program
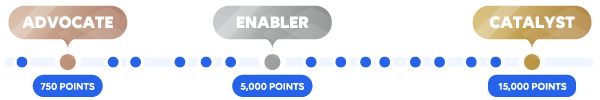
| Acquired rank |
Catalyst
|
| Points progress |
6226
DevOps Points
|
 Here are a few tips to level up your DevOps game and unlock an arsenal of perks and benefits. Here are a few tips to level up your DevOps game and unlock an arsenal of perks and benefits.
|
|
| DevOps attestation | Request your attestation ID and expiry date |
Achievements
|
|
Questions asked
Answers given
Hi Daniel It is currently not possible to use your own fonts in Dashboards or Low Code Apps (not in the themes & not in the web component). There are also no tasks on our backlog to add this feature....
View QuestionHi Ashwini, Or filtering is not possible using the 'Contains' filter method. You can achieve your desired result using the 'Regex' method. For example: '^(WoutMH|Test Element 1)$' will show all elements...
View QuestionHi Jens, For this you can use the On open event of a page or panel to execute the Set value action of the toggle component. This action will explicitly set the value of the component, ignoring any...
View QuestionHi Felix, There is an option to skip the abort confirmation when aborting the script. This is available in LCA from DataMiner 10.3.0[CU21], 10.4.0[CU9] & 10.4.12 onwards.
View QuestionHi Martin There is currently no easy way to update/delete an image from within Dashboards/Low Code Apps itself. It can safely be deleted from C:\Skyline DataMiner\dashboards\_IMAGES, this will have to...
View QuestionHi, The login form of our web apps indeed has ids change every time the page is loaded. I'm not familiar with CyberArk, but using the documentation link you provided I noticed that you should be able...
View QuestionHi Tim, It is possible to feed multiple query rows at once from a table and use this as a script input. You can configure an action to execute a script on a header bar button, a button component or use...
View QuestionHi Jim, You can link the output of the automation script back to the Low Code app via the 'Script outputs' feed of the button used to execute the script. This feed represents key-value pairs where the...
View QuestionHi Joshua It is not possible to move components between pages and panels. What you can do starting from 10.4.12 is using the new flows. These allow you to make use of multiple different data objects...
View QuestionHi Enver, This is possible using the latest version of LCA. You can configure the panel with feeds from both the table & node-edge component. To make sure that the correct data is displayed when a...
View QuestionHi Miguel Case 1 & 2 are both possible for markers, but noy yet for lines: Because each marker is a template, the template editor can be used to configure actions to execute on a shape level. This...
View QuestionHi Jim, This sounds like a perfect case for the grid component, available out of softlaunch from 10.4.1 onwards. You can link a query to the grid component that fetches the rows from the parameter table...
View QuestionHi Tarik, This is indeed possible, the only thing you need is the embed link from the live stream. you can get this from the YouTube stream itself by clicking 'Share' and then 'Embed'. This will show...
View QuestionHi Felix, You could already implement this using the template of a grid component and a text shape. Since the text shape can have custom HTML (based on the column values), you can create your own UI....
View QuestionHi Mieke, If this column is a string column, you can use a regex filter method to act as an 'OR' filter. Other than this workaround, there are no 'OR' conditions in GQI.
View QuestionHi Yuki, Currently, the color of the button component cannot be dynamically changed. To achieve your use case in a different way, you could make use of a grid component. The component makes use of query...
View QuestionHi Arie-Jan Thanks for providing the additional info. I see that you are currently using version 10.3.0 for both Server & Web. On the docs page for the ping monitoring app, I found that the minimum...
View QuestionHi Mieke Passing all selected rows to the script is currently only possible when linking to the 'Tables' type (formerly known as 'query rows'). The 'Object manager instance' type will only fill in the...
View QuestionHi Miloš, Depending of the version of your web apps, this can be done in 2 ways: Before table cell templates: < 10.4.1 You can configure an action on the table to execute via a 'Text hyperlink'....
View QuestionHi Vikas, The default layout for a PDF export of a dashboard has the 'Stack components' option enabled. Disabling this option will position the components as you see on the dashboard. Disabling the option...
View QuestionHi Leander, The behavior you encountered is a known limitation of the GQI templates. Currently it is not possible to configure templates for data coming from a feed, only the default template can be used....
View QuestionHi Andrew, There is currently no option to 'freeze' a table column just as with Excel. If you want this, you can open a feature suggestion. If this topic gets enough support, we can consider putting it...
View QuestionHi Mieke, To filter the data in your table, you can link the time range component as a feed to the query. To do this, you will need to add 2 filter nodes to user the 'From' and 'To' feeds of the time...
View QuestionHi Daniel, It is very hard to debug what might be going wrong in your LCA without more information. I suggest you get in touch with tech support (support@dataminer.services) so that we can look further...
View QuestionHi Catarina, There is no way to disable the sorting and grouping functionality of the table component. A user will always be able to sort, group & filter the table further to get a personalized view....
View QuestionHi Jens, Unfortunately there is currently no way to re-order these using the LCA UI. The only way to achieve this is by re-creating them in the order you need.
View QuestionHi Harun, I'm not quite sure what you mean when you say 'embedding a dashboard brings in the entire dashboard'. You probably mean that the side-panel with the folder structure is also loaded. To prevent...
View QuestionHi Dario, This can be done by adding text data to the URL for the component to use. Here is an example of such a data object: data={ "version": 1, "components": [ { "cid": 27, "select": { "strings": ["Your...
View QuestionHi Alberto, It is not possible to link the colors in the dashboard directly to the XML file. Dashboards has no concept of 'severities', only of (conditional) data colors. The order of the colors in the...
View QuestionHi Joseph, There is currently no way to do this using the UI, but there are API methods available to export your LCA and import it again on an other agent. Exporting an LCA can be done via https://DMAIP/API/v1/Internal.asmx/ExportApplication....
View QuestionHi Baranisudha, The LCA versions that are kept are not based on time but on amount of versions. When creating new versions of an LCA, only the last 15 versions are kept. If the limit is reached, the oldest...
View QuestionHi, It is possible to create your own hyperlinks on a dashboard using the web component with custom HTML. These can be statically defined or linked to data using interpolation. Note that is however not...
View QuestionHi Stefan, If you just want to display the values of the columns in a custom way, I would suggest to use the Web component. The component can use the data from the selected row via interpolation and display...
View QuestionHi Juan, The DataMiner WebAPI needs authentication for most methods because they access DataMiner data, which has user-based security applied. For example: the 'GetAlarmStateTimelineForService' endpoint...
View QuestionHi Catarina, I tried creating & sharing a dashboard like you show without any issues. To investigate further, We would need to take a look at the permissions and WAF rules that have been created for...
View QuestionHi Riccardo, The value '7' is indeed not a valid value for the DefaultTimeZone in these settings. There are 2 options to fix this: Remove that setting from the file. This means that the time zone of...
View QuestionHi Thomas, This isn't possible in the template editor itself. I suggest you create an extra column using a custom operator that contains the result of this comparison. Then that column can be used for...
View QuestionHi Apurva Configuring what data is shown in the tooltip can be done by adding query columns as a filter to the component. Only the columns that are added will be shown in the tooltip. Adding an...
View QuestionHi Apurva, The height of a panel in a LCA can currently not be controlled. This is however something that makes sense in the case of panels as a popup. I have created a task for us to support this, we...
View QuestionHi Dieter, This is definitely possible using the 'Line & area chart' component. To display the lines using different colors, you have to customize the component theme. In the theme you can choose...
View QuestionHi Marco The Web component doesn't have a restriction on http vs https. It only enforces the use of https when the LCA itself is visited using https (which we highly recommend). When using https, most...
View QuestionHi Alija It should be no problem to add multiple independent trigger components to a page or panel. What happens exactly when you try adding a new trigger component? If it doesn't show up on the page,...
View QuestionHi Carlos, Are you seeing this when using the exact same query on both the dashboard & in the LCA? GQI has 2 different ways of updating data that depend on the used data source & operators in...
View QuestionHi Wale It is not possible to hide this filter, without modifying your data. It is shown because the underlying 'MCR Status' column is a discrete column with numeric values. You could modify this column...
View QuestionHi Baranisudha This can be achieved using Table templates. These templates allows you to style any table cell the way you want and to create actions and conditions based on the data. To learn more about...
View QuestionHi Davor I see that you are using a GQI query for your use case. You can configure this in a few steps: Add a line & area chart component and time range component to the dashboard. Create query...
View QuestionHi Dario You are indeed seeing different visualizations because of the different versions. With DataMiner 10.3.0[CU13]/10.4.0[CU1]/10.4.4, we introduced the ability to show the results of a query in a...
View QuestionHi, We have some features in Dashboards & Low Code Apps that make creating custom visuals possible: The web component can be used to create a custom visual. You can link some feeds to insert data...
View QuestionHi John, Currently it is only possible to do this by manipulating the app files themselves, there is no UI for this. You can assign a/multiple section to a LCA following these steps: Locate the app...
View QuestionHi Randy, To display icons in a template, you need to use the icon tool. When you have created a new icon layer/selected an existing icon layer, the icons become available on the right side of the editor.
View QuestionHi Kevin, By default, the cells of a table will not show HTML as HTML. To view this as HTML, the only thing you have to do is to overwrite the cell with a custom template. Even the default template will...
View QuestionHi, This is currently not possible in any of our web apps, the 24-hour format is always used. If you would want us to support this format, you can create a feature request.
View QuestionHi Dieter, You can change the view & edit permissions of a dashboard in the 'settings' while having no component selected. Removing the view restriction should make the dashboard shareable via the...
View QuestionHi Lucas, Can you tell us what version of the web apps you are using? You can find this by clicking on your user icon in the top right & then selecting about. We have fixed an issue with not being...
View QuestionHi Nathan To make sure that the grid templates take the available width, you have to create your template so that it can handle that. This means that you should not lock the width of your background shape...
View QuestionHi Laurent, There are only a few ways to edit parameters in a LCA: Using a parameter page component This is the most basic way, but will always show an entire parameter page at once. Using a custom...
View QuestionHi Mark, Are you accessing the monitoring app using a machine with the same time zone? The app automatically adapts the displayed times to the time zone of the user. It is possible to overwrite this...
View QuestionHi Jens, This is definitely possible using DOM instances: Assigning the icons can be done using a form component with the DOM instance or a DOM definition as data. The definition will have to have a...
View QuestionHi Leander, To achieve this, you can create a flow that merges the outputs of each of the time range components. This flow can then be used as the input data for each component. Updating one time range...
View QuestionHi Martin, There seems to be an issue with the serialization of the response when using the SOAP API. I have created a task for us to fix this, we will let you know here when a fix has been implemented.
View QuestionHi Andrew, The new columns that are generated after the column manipulation node are included in all nodes that come after it. Adding a select node after the manipulation should allow you to re-order...
View QuestionHi, The 'Save as component theme' button is only enabled for your own custom themes. Clicking it will add the current custom settings as a component theme to the dashboard theme. When you are using a...
View QuestionHi Marco, The condition input for string columns in templates is always for a 'contains' condition. It is currently not possible to use a regex here. You could invert the condition and make the default...
View QuestionHi Joe, The alarm table component has a 'Group by' setting that allows you to group by Time, Severity or not at all (by clearing the input using the 'X'). Expanding all groups by default is not possible...
View QuestionHi Matt, It isn't possible to user variables or other data in the title of visualizations. Instead you can add a Text of HTML component on the page that displays the desired text combined with some modified...
View QuestionHi Stefan, The behavior you are expecting is indeed correct; with the 'Select first item by default' setting enabled, the grid should select the first item. This should function identically as when a...
View QuestionHi Sebastian, To make columns wider, you can edit their template and change the width of the template itself. For this, you will need to have no layer selected, which will show the dimensions on the right...
View QuestionHi Michael, A new layer is automatically created for every 'shape' that is added using a 'tool'. You can find more info in the docs. The duplication feature is only available starting from DataMiner 10.5.5...
View QuestionHi Wale, There is currently no feature like this in Dashboards. If you are interested in this, you can create a feature suggestion. As an alternative solution, you could create a Low Code App with multiple...
View QuestionHi Baranisudha, You could use the text input or search input component in your LCA. These both accept text as input and can be linked to a query. They both also have some settings to customize the look...
View QuestionHi Davor, This can be achieved by executing some actions when clicking a marker on the first maps component: 'Open a panel' action to open the panel with the second maps component. 'Set zoom level'...
View QuestionHi Jonas, Without looking at the files, you can find this using the developer tools of your browser. You can open them by using Ctrl+shift+i and then navigate to the network tab. With this tab open,...
View QuestionHi Robin, All interactive script should be supported in the IAS component. If you are seeing this error with a script that does execute fine in Cube and using an action, then you have probably encountered...
View QuestionHi Johan, Before DataMiner 10.4.0[CU14] / 10.5.0[CU2] / 10.5.5, the groups were created based on the order in which the items were fetched using the query. This means that you should be able to apply...
View QuestionHi Wale, This is currently not possible, only importing templates from components in the same LCA is supported. We do have plans to make this possible in some way, but nothing is decided yet.
View QuestionHi Ive, When using 'fit to view' this means that all components will scale their vertical size to the current screen height and there will be no scrollbar on page level. This unfortunately also means...
View QuestionHi Stefan, To use the result of a query in another component, you will have to use a component that executes the query and visualizes the result. It is currently not possible to retrieve query results...
View QuestionHi Thomas, The current version of the Gauge component can only visualize parameters. Showing the count from your query is not supported.
View QuestionHi Martin, Using GQI would indeed be an option here since the list visualization can display query results. You can create a query to fetch the necessary elements based on the selection in the fist list...
View QuestionHi Steve, This is indeed possible using the Web component leveraging the data interpolation feature. You can use the DMAIP value and the View ID (from a table) to create the url: https://{URL.DMAIP.Value}/monitoring/view/{COMPONENT."Table...
View QuestionHi Apurva, We have recently improved this behavior with DataMiner 10.4.0[CU12]/10.5.3. From that version onwards, the table will stay at the current scroll position when re-fetching data. There will be...
View QuestionHi Wale, You are only seeing the status filters that would match any data when used. This is because the 'Filter assistance' setting of the query filter is turned on. This setting will notify the component...
View QuestionHi Jens, Components that are using the exact same query will only execute the query once if they request data at the same time. When one of the components would request its data at a later time, eg when...
View QuestionHi Felix, We currently do not have a component that can be used as a kanban board using drag & drop. It is possible to create your own version using DOM, GQI, grid components with templates &...
View QuestionHi Harald This is a correct observation. The 'Feeds' dataset has been retired in favor of 2 new datasets: 'Components' & 'Url'. you can read more about this in a recent blogpost. Functionally, everything...
View QuestionHi Ruben Unfortunately, the scroll position of the grid component will always be reset after a re-fetch in the current software version. I have created a task on our backlog to change this behavior, we...
View QuestionHi Wale, All columns that are retrieved using GQI will be available in the feed. If they are filtered out using a 'select' node, they are not in the query result and thus not in the feed. To achieve your...
View QuestionHi Geovanny Generating a PDF is process with multiple steps, one of which is stitching the different parts together using the ComposePDF call you found. While it is technically possible to create all...
View QuestionHi Felix It is currently not possible to link a dummy to a script action using a feed, this only works for parameters. I have create a task on our backlog to implement this As a workaround you could...
View QuestionHi Miguel Showing the different alarm levels underneath the parameter like this is currently not possible in the web version of Monitoring. I have created a task on our backlog to align this with Cube.
View QuestionHi Kévin, It is currently not possible to customize the group headers of grouped rows. Table templates are only supported for normal rows. We have already received a feature task to support your use...
View QuestionHi Gerwin, Your expectations make a lot of sense and this is also what we want the behavior to be in the future. At the moment we have some cases where 1 row could represent multiple DOM instances, elements,...
View QuestionHi Reinout To show images in a template, you can indeed use the text shape with some HTML code inside. In my example here I used a static image with a fixed width & height, but these can also be linked...
View QuestionHi Marco, You can use a 'navigate to url' action with feed linking for this. Inside the url, you can use the feed values from the dropdown and text inputs. Here is an example that will navigate to google...
View QuestionHi Mauro, The 'Fetch the data' action is completed when the data is done fetching. The issue you are having is that the reselection of the table rows hasn't happened yet. This means that the 'query rows'...
View QuestionHi Yahya, There is a 'Rename column' custom operator available on the catalog that can be used for this. An other option would be to rename the column using a 'concatenate' column manipulation with...
View QuestionHi Tim, This is achievable by adding query column as a Group to a dashboard component. The columns of a query can be found by clicking the expander in front of the query name. This grouping will be...
View QuestionHey Mieke, As Robin mentioned, it is possible to use a feed in the Web component. This can be used together with the Script outputs feed from the button component to dynamically change the URL based on...
View QuestionHi Gerwin, Currently this is not possible when using GQI data on a line chart component. We are developing multi-line/multi-axis support for the component as we speak. This, and some other enhancements,...
View QuestionHi Dieter, Sharing a dashboard using the URL will include all the feeds that are currently set in the dashboard as a url parameter. These are included to ensure that everyone that clicks the link gets...
View Question