Hi Dojo,
Checking the DataMiner metrics in the Help documentation, specifically the following ones regarding SNMP traps:
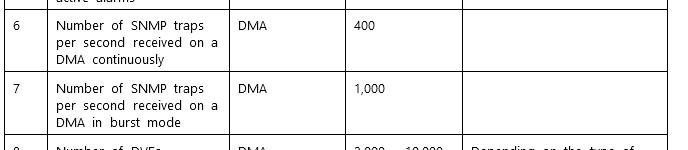
I was wondering:
- Can these values be tested on the DataMiner side? Or is it something that needs to be checked on the device side using some tool like Wireshark?
- What is the difference between the usual SNMP trap and burst mode? Am I correct assuming this is something configurable on the device?
Thank you for the help. Cheers!
João Pereira [SLC] Selected answer as best
Hi Joao,
Regarding your first question, there are two possible option to count the number of traps that a DMA is retrieving:
- Using Wireshark. If possible try to define a proper filter so the capture only includes the SNMP traps coming to the DMA. For example you could use the following filter: dst host 10.11.12.13 and dst port 162 (where 10.11.12.13 is the IP address assigned to the NIC card that receives the SNMP traps). In this case I am assuming that the port configured to receive traps is 162.
- Using the Generic Trap Receiver driver. You can create an element using this driver and set the parameter Trap IP Sources with the wildcard ‘*’. This wildcard will make the element to add in the Traps table any trap that is sent to the DMA.
Regarding your second question, if I am not mistaken ‘burst mode’ depicts an exceptional case where a DMA receives (during one second) a large amount of traps. For example, assume that a DMA was receiving 10 traps every second continuously and suddenly it receives a burst of 2000 traps (in one second). According to the metrics, up to 1000 traps will be processed by the DMA.
João Pereira [SLC] Posted new comment
Thank you Miguel, really appreciate the tips.
You are correct Miguel. Burst mode refers to how many traps DataMiner can ingest and process when they come in a big spike. This is not something that is related to a setting on an underlying managed device or system.