Skip to content
DataMiner DoJo

More results...

Generic selectors
Exact matches only
Search in title
Search in content
Post Type Selectors
Search in posts
Search in pages
Search in posts
Search in pages
Log in
Menu
  • Updates & Insights
  • Questions
  • Learning
    • E-learning Courses
    • Empower Replay: Limited Edition
    • Tutorials
    • Open Classroom Training
    • Kanban workshop
    • Certification
      • DataMiner Fundamentals
      • DataMiner Configurator
      • DataMiner Automation
      • Scripts & Connectors Developer: HTTP Basics
      • Scripts & Connectors Developer: SNMP Basics
      • Visual Overview – Level 1
      • Verify a certificate
    • Video Library
    • Books We Like
    • >> Go to DataMiner Docs
  • Expert Center
    • Solutions & Use Cases
      • Solutions
      • Use Case Library
    • Markets & Industries
      • Media production
      • Government & defense
      • Content distribution
      • Service providers
      • Partners
      • OSS/BSS
    • Agile
      • Agile Webspace
      • Everything Agile
        • The Agile Manifesto
        • Best Practices
        • Retro Recipes
      • Methodologies
        • The Scrum Framework
        • Kanban
        • Extreme Programming
      • Roles
        • The Product Owner
        • The Agile Coach
        • The Quality & UX Coach (QX)
    • DataMiner DevOps Professional Program
      • About the DevOps Program
      • DataMiner DevOps Support
  • Downloads
  • More
    • DataMiner Releases & Updates
    • Feature Suggestions
    • Climb the leaderboard!
    • Swag Shop
    • Contact
    • Global Feedback Survey
  • Support
  • PARTNERS
    • All Partners
    • Technology Partners
    • Strategic Partner Program
    • Deal Registration
  • >> Go to dataminer.services

How to remove extensive decimal points in Visio

150 views23rd May 2025decimal points decimals excecssive significant figures Visio
1
FAWZAN KHAIZURAN FAUDZI [DevOps Advocate]150 22nd May 2025 0 Comments

Hi everything,

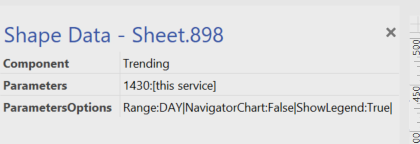
I am doing a Visio; however, the data grabbed contains  alot of useless decimal point as shown as below:

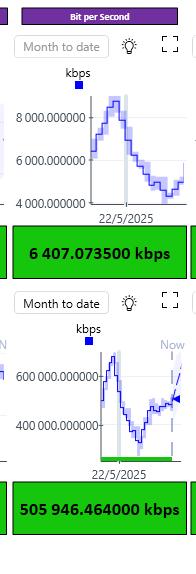
Hence, how can I remove this decimal points OR just make it to 2 decimal places?

As shown below is my syntax for the graph:

As shown below is the syntax for that greenbox

Thank you very much for your assistance and have a nice day!

Miguel Obregon [SLC] [DevOps Catalyst] Answered question 23rd May 2025

2 Answers

  • Active
  • Voted
  • Newest
  • Oldest
1
Miguel Obregon [SLC] [DevOps Catalyst]19.21K Posted 23rd May 2025 0 Comments

Hi Fawzan,

Please could you let us know the connector that you are using for the trend chart? It could be the case that you are using dynamic units. If this is the case, as far as I know it is not possible to reduce the decimal numbers.

Hope it helps.

Miguel Obregon [SLC] [DevOps Catalyst] Answered question 23rd May 2025
1
Steve Purcell [SLC] [DevOps Advocate]1.71K Posted 22nd May 2025 1 Comment

Hi Fawzan,

You can try adding a shape data filed 'Options', then 'Decimals=2' for the value.

This should display the returned value with 2 decimal places.

Thanks,

Steve

FAWZAN KHAIZURAN FAUDZI [DevOps Advocate] Edited comment 23rd May 2025
FAWZAN KHAIZURAN FAUDZI [DevOps Advocate] commented 23rd May 2025

Nice!

Thank you Steve! It works on that Green Box.

However for the chart above, it still remains the same.. there is still a lot of decimal places on y axis.
* * *
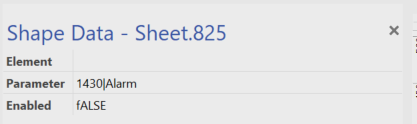
This is my syntax for that chart:
——————————————————————————————————————————
Component: Trending
Parameters: 1431:[this service]
ParametersOptions: Range:DAY|NavigatorChart:False|ShowLegend:True|
Options: Decimals=2
——————————————————————————————————————————
I also tried to do like this:
——————————————————————————————————————————
Component: Trending
Parameters: 1431:[this service]
ParametersOptions: Range:DAY|NavigatorChart:False|ShowLegend:True|Decimals=2
——————————————————————————————————————————
and this:
——————————————————————————————————————————
Component: Trending
Parameters: 1431:[this service]
ParametersOptions: Range:DAY|NavigatorChart:False|ShowLegend:True|Decimals:2
——————————————————————————————————————————
However, the chart still has a lot of decimals.. haha.. might be there a specific syntax for the chart?

Thank you very much for your assistance and have a nice day!

Please login to be able to comment or post an answer.

My DevOps rank

DevOps Members get more insights on their profile page.

My user earnings

0 Dojo credits

Spend your credits in our swag shop.

0 Reputation points

Boost your reputation, climb the leaderboard.

Promo banner DataMiner DevOps Professiona Program
DataMiner Integration Studio (DIS)
Empower Katas
Privacy Policy • Terms & Conditions • Contact

© 2025 Skyline Communications. All rights reserved.

DOJO Q&A widget

Can't find what you need?

? Explore the Q&A DataMiner Docs

[ Placeholder content for popup link ] WordPress Download Manager - Best Download Management Plugin