We want to monitor if a specific user account is logged in to DataMiner / Cube. Manually, one can see which contacts (= user accounts) are currently logged in by checking the menu presented when clicking the current user’s icon in the upper left corner. Is there any way to check this information in some kind of process, so we can work with this information? We have checked Information Events, but for some reason there are information events popping up related to user log in’s / log off’s even when the user is not actively changing it’s status. So this does not seem to be a reliable source of information.
Thanks! 🙂
Hi guys,
You could use the following code to get an overview of all active connections on the system:
DiagnoseMessage diagnoseMessage = new DiagnoseMessage()
{
Type = DiagnoseMessageType.OpenConnections
};
var diagnoseResponse = (TextMessage)engine.SendSLNetSingleResponseMessage(diagnoseMessage);
engine.GenerateInformation(diagnoseResponse.Text);
Note that this is an internal call and we cannot guarantee that it will still work in the future. SLNet calls are subject to change without notice.
This will output something like below, so you should create further logic to filter out only user connections and the required data.
You can see the user, connection time and also last activity time.
Active SSPI (no DLL) Auth Threads: 0
Global active incoming calls: 1 (peak: 13)
Global active incoming calls via async requests: 0 (peak: 7)
Internal: SetFunctionResourceStates (DataMiner) – ID: 95eb6835-3012-41e3-8fd1-c1038f65f85f – Rx: 15674 – Tx: 0
Subscription: [callback] [local:-1] ElementStateEventMessage [SkipInitialEvents],
DataMiner (SLDataGateway) – (connected: 05/18/2023 06:05:34 – last activity: 05/26/2023 14:51:28) [NOT ENCRYPTED][serialize for 10.2.2143.19420]
ID: 3bf27dcd-6a95-49d6-9668-aab7594cf427 Rx: 3983 (3981/69) Tx: 768 Active: 0/3 Async: 0/0 Re: 0
Bytes IN: 1.46 GB (requests)
Bytes OUT: 719.84 KB (responses); 3.66 MB (events)
Attributes: DataMinerClient, KeepConnectionIfNoAgentRunning
Transport: DotNetRemoting
Amount Queued Subscription Updates: 0
Subscription: [callback] [slnet-ipc-callback-2632-30ec0a18-ccae-446a-951d-e7c536026272$]
Internal: Connectivity Manager Subscriptions (DataMiner) – ID: 893fd1eb-6253-4cd2-8a15-bf3ee1239235 – Rx: 21 – Tx: 0
Subscription: [callback] [local:-1] InterfaceInfoEventMessage(DMA -1 on 17),InterfaceInfoUpdateEventMessage(DMA -1 on 17),
Dashboard (Administrator @ XXX) [ v10.2.2143.19420] – (connected: 05/25/2023 12:40:42 – last activity: 05/26/2023 14:51:29)[serialize for 10.2.2143.19420]
ID: 4ec87970-c5f4-4454-a7a6-357c58a6e0a6 Rx: 20 (18/132) Tx: 5077 Active: 0/1 Async: 0/0 Re: 0
Bytes IN: 41.40 KB (requests)
Bytes OUT: 36.17 KB (responses); 7.32 MB (events)
Attributes: Zip, WebApp, Encrypt, AllowMessageThrottling
Transport: DotNetRemoting
ProtoBuf: Enabled (version: 10.2.2143.19420)
Amount Queued Subscription Updates: 0
Subscription: [callback] [slnet-ipc-callback-22660-30db9da2-974b-4fa8-91c0-45193d39e1d0$]
Cube (Wouter Bogaert @ YYY) [10.4.1.27 v10.3.2317.2386] – (connected: 05/26/2023 14:48:06 – last activity: 05/26/2023 14:51:32)[serialize for 10.3.2317.2386]
ID: 11d9d2a5-563b-4da7-95af-75edbff33037 Rx: 371 (369/81) Tx: 0 Active: 0/4 Async: 0/2 Re: 0
Bytes IN: 532.18 KB (requests)
Bytes OUT: 2.74 MB (responses); 0 bytes (events)
Attributes: 1210589316
Transport: DotNetRemoting
ProtoBuf: Enabled (version: 10.2.2143.19420)
Amount Queued Subscription Updates: 0
Subscription: [2 queued (overflowcheck: 1)]
[Registered on ViewStateEvent updates]
HTML5 App (Administrator @ XXX) [ v10.2.2143.19420] – (connected: 05/25/2023 12:38:34 – last activity: 05/26/2023 14:51:32)[serialize for 10.2.2143.19420]
ID: 619b9740-52f3-42eb-823f-ff6bdf9996fe Rx: 38085 (38083/67) Tx: 5028 Active: 0/2 Async: 0/1 Re: 0
Bytes IN: 42.18 MB (requests)
Bytes OUT: 186.82 MB (responses); 18.74 MB (events)
Attributes: WebApp, Encrypt, AllowMessageThrottling
Transport: DotNetRemoting
ProtoBuf: Enabled (version: 10.2.2143.19420)
Amount Queued Subscription Updates: 0
Subscription: [callback] [slnet-ipc-callback-22660-72ec2e7d-75cd-4a99-b3d9-90be8550ec46$]
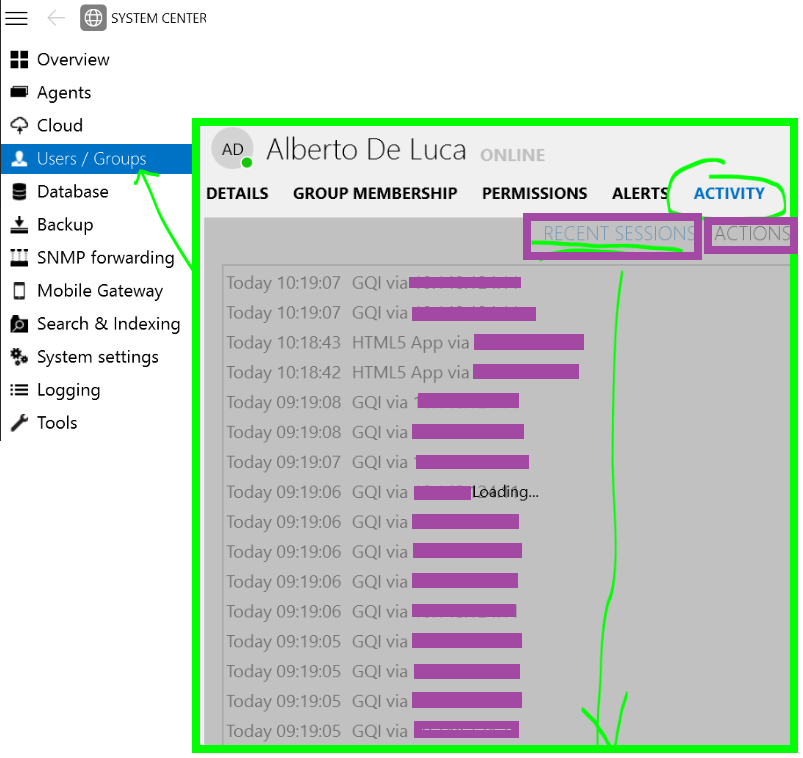
Subscribing as I have a similar use case – I can refer to this kind of data in System center for the past sessions: wondering if there is a way to retrieve at least some of these stats (e.g. for the active sessions) via an API call?

I believe we have a similar use case to submit – something where the active users can be checked via an “API” query perhaps, to know at a glance who are the users available at a given time (e.g. during an out of hours incident).
The system is keeping trace of user activity (System Center / Users / Activity), by keeping logs of the most recent sessions and the related actions in each of those (adding a screenshot later).