I am looking for a report to show the top CPU utilization(average of the day/max of the day) (the % value, not the number of alarm) for elements in a view or sharing a protocol.
I checked on the Dojo but I didn’t find it, can you tell me how to do it please?
Christine – this would be based on some GQI queries. A lot of the items that you mention are used probably in the Microsoft Servers App on ziinedev. So that would probably a good source for you to learn about some of the queries that you are looking for.
NOTE: the system I reference here is currently not available for non-Skyline people, we are working on building up more reference examples on the public platform that anybody with a Dojo account can also access: https://ziine.skyline.be/
Hi Christine,
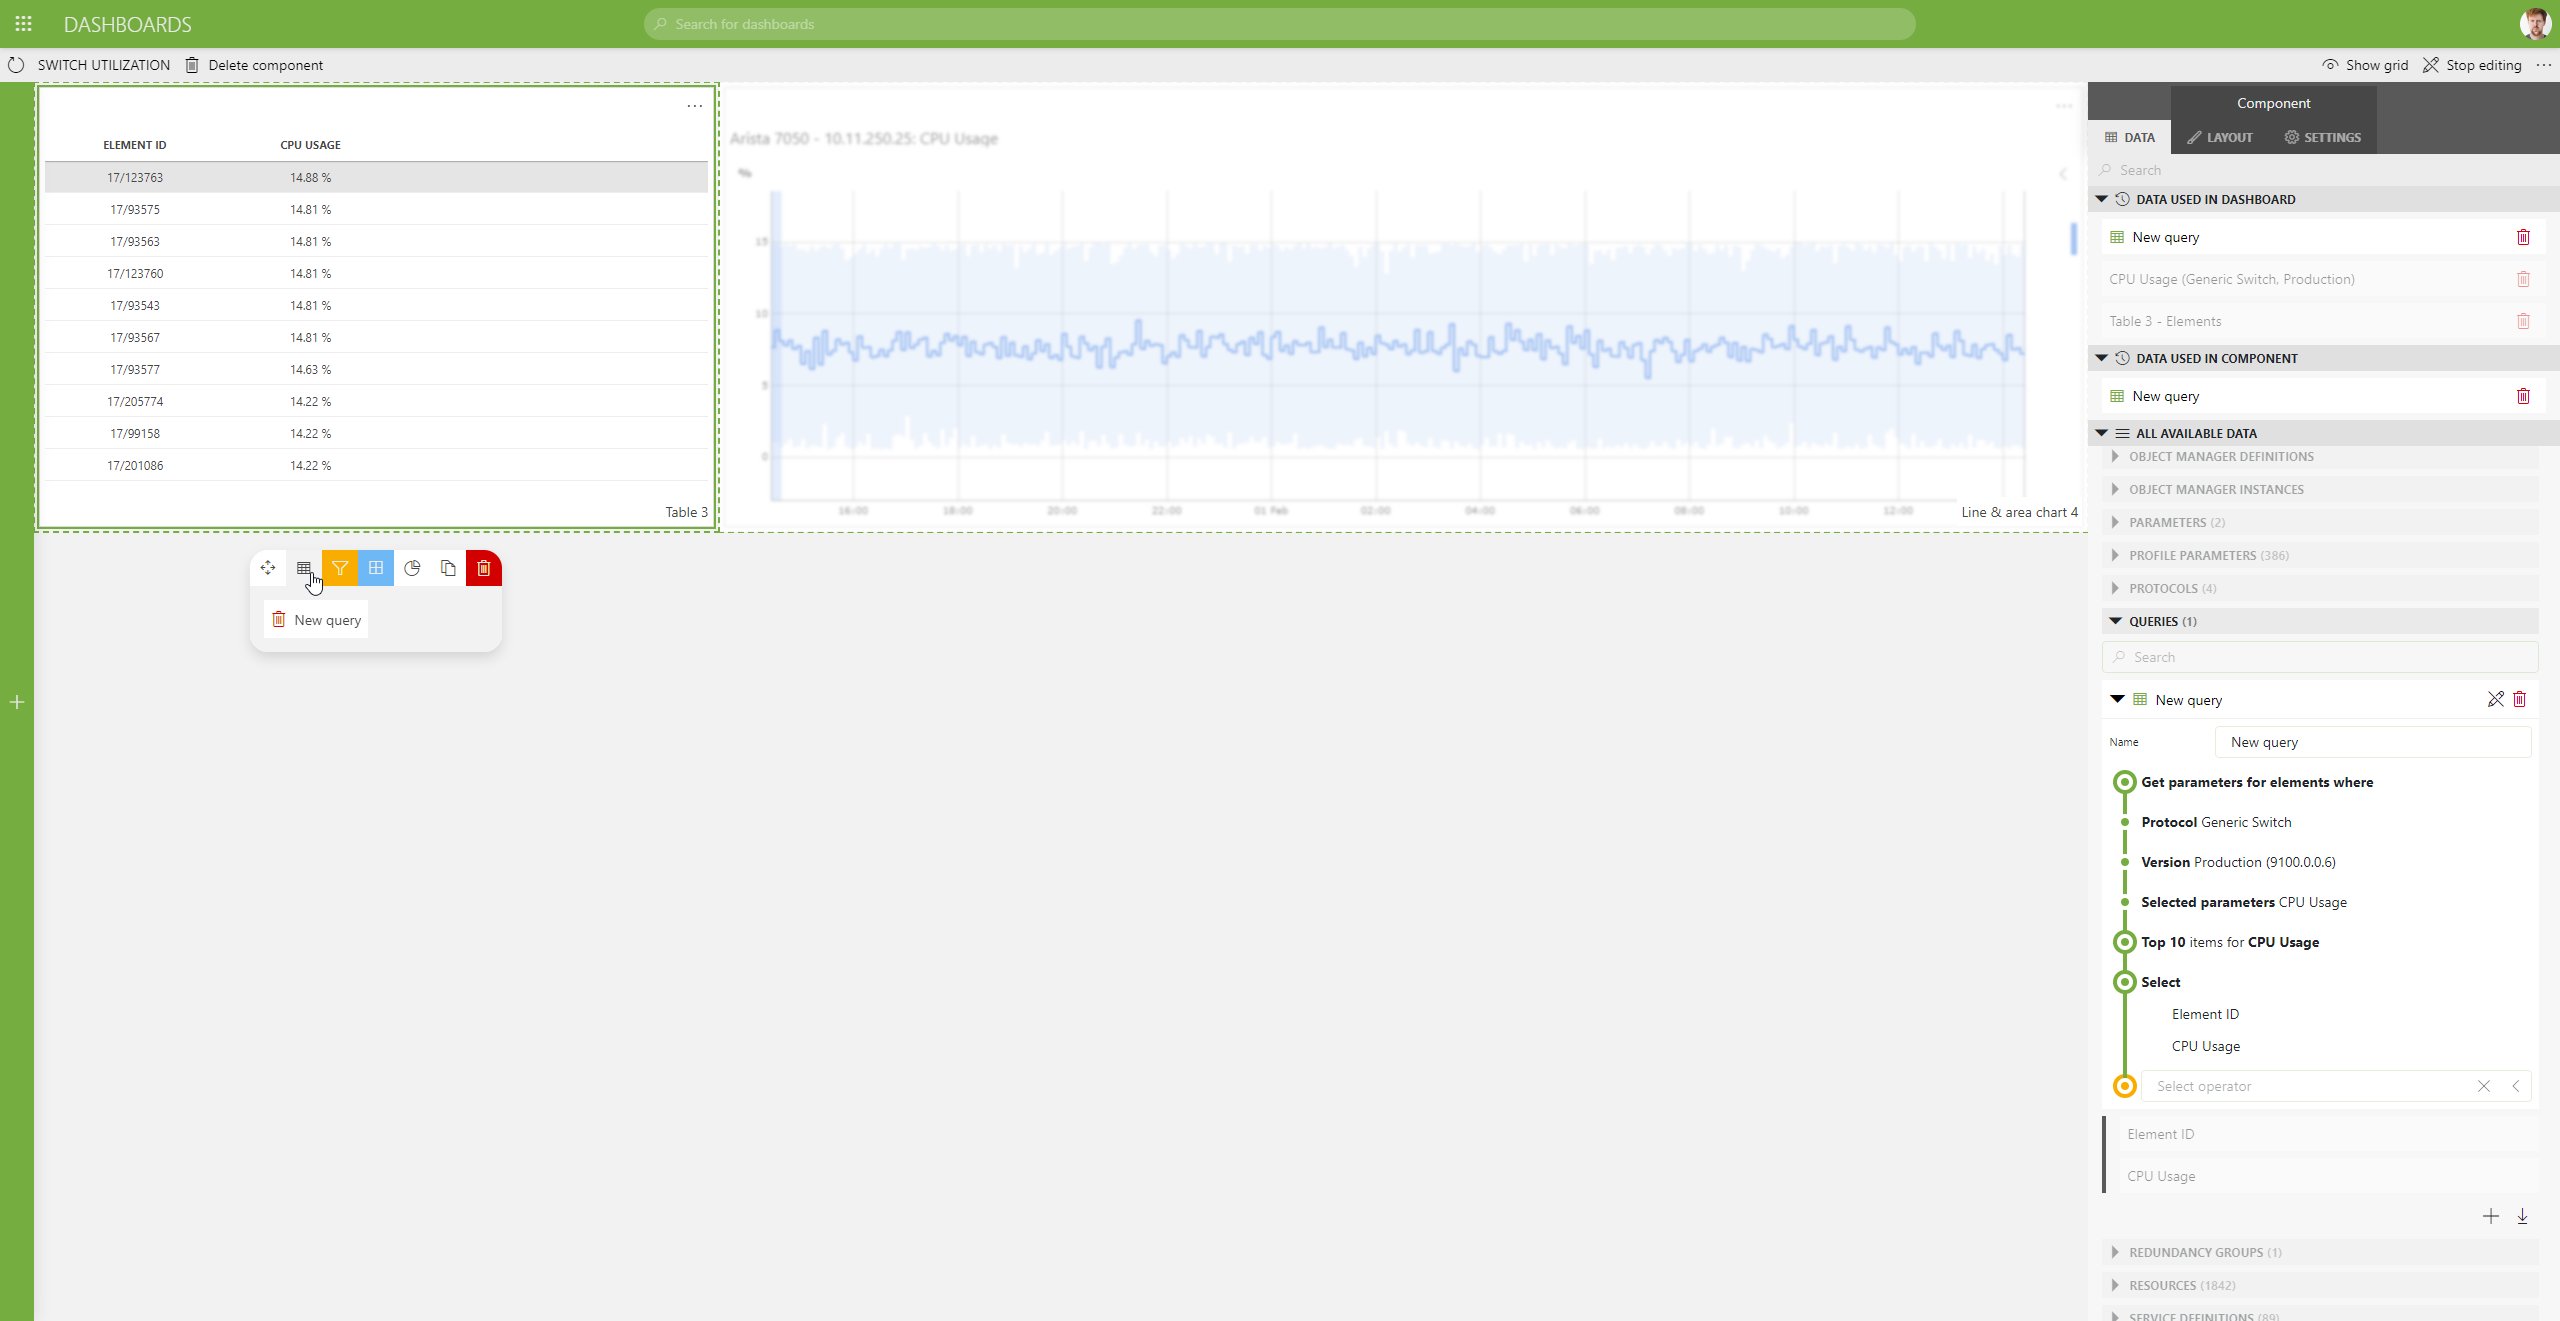
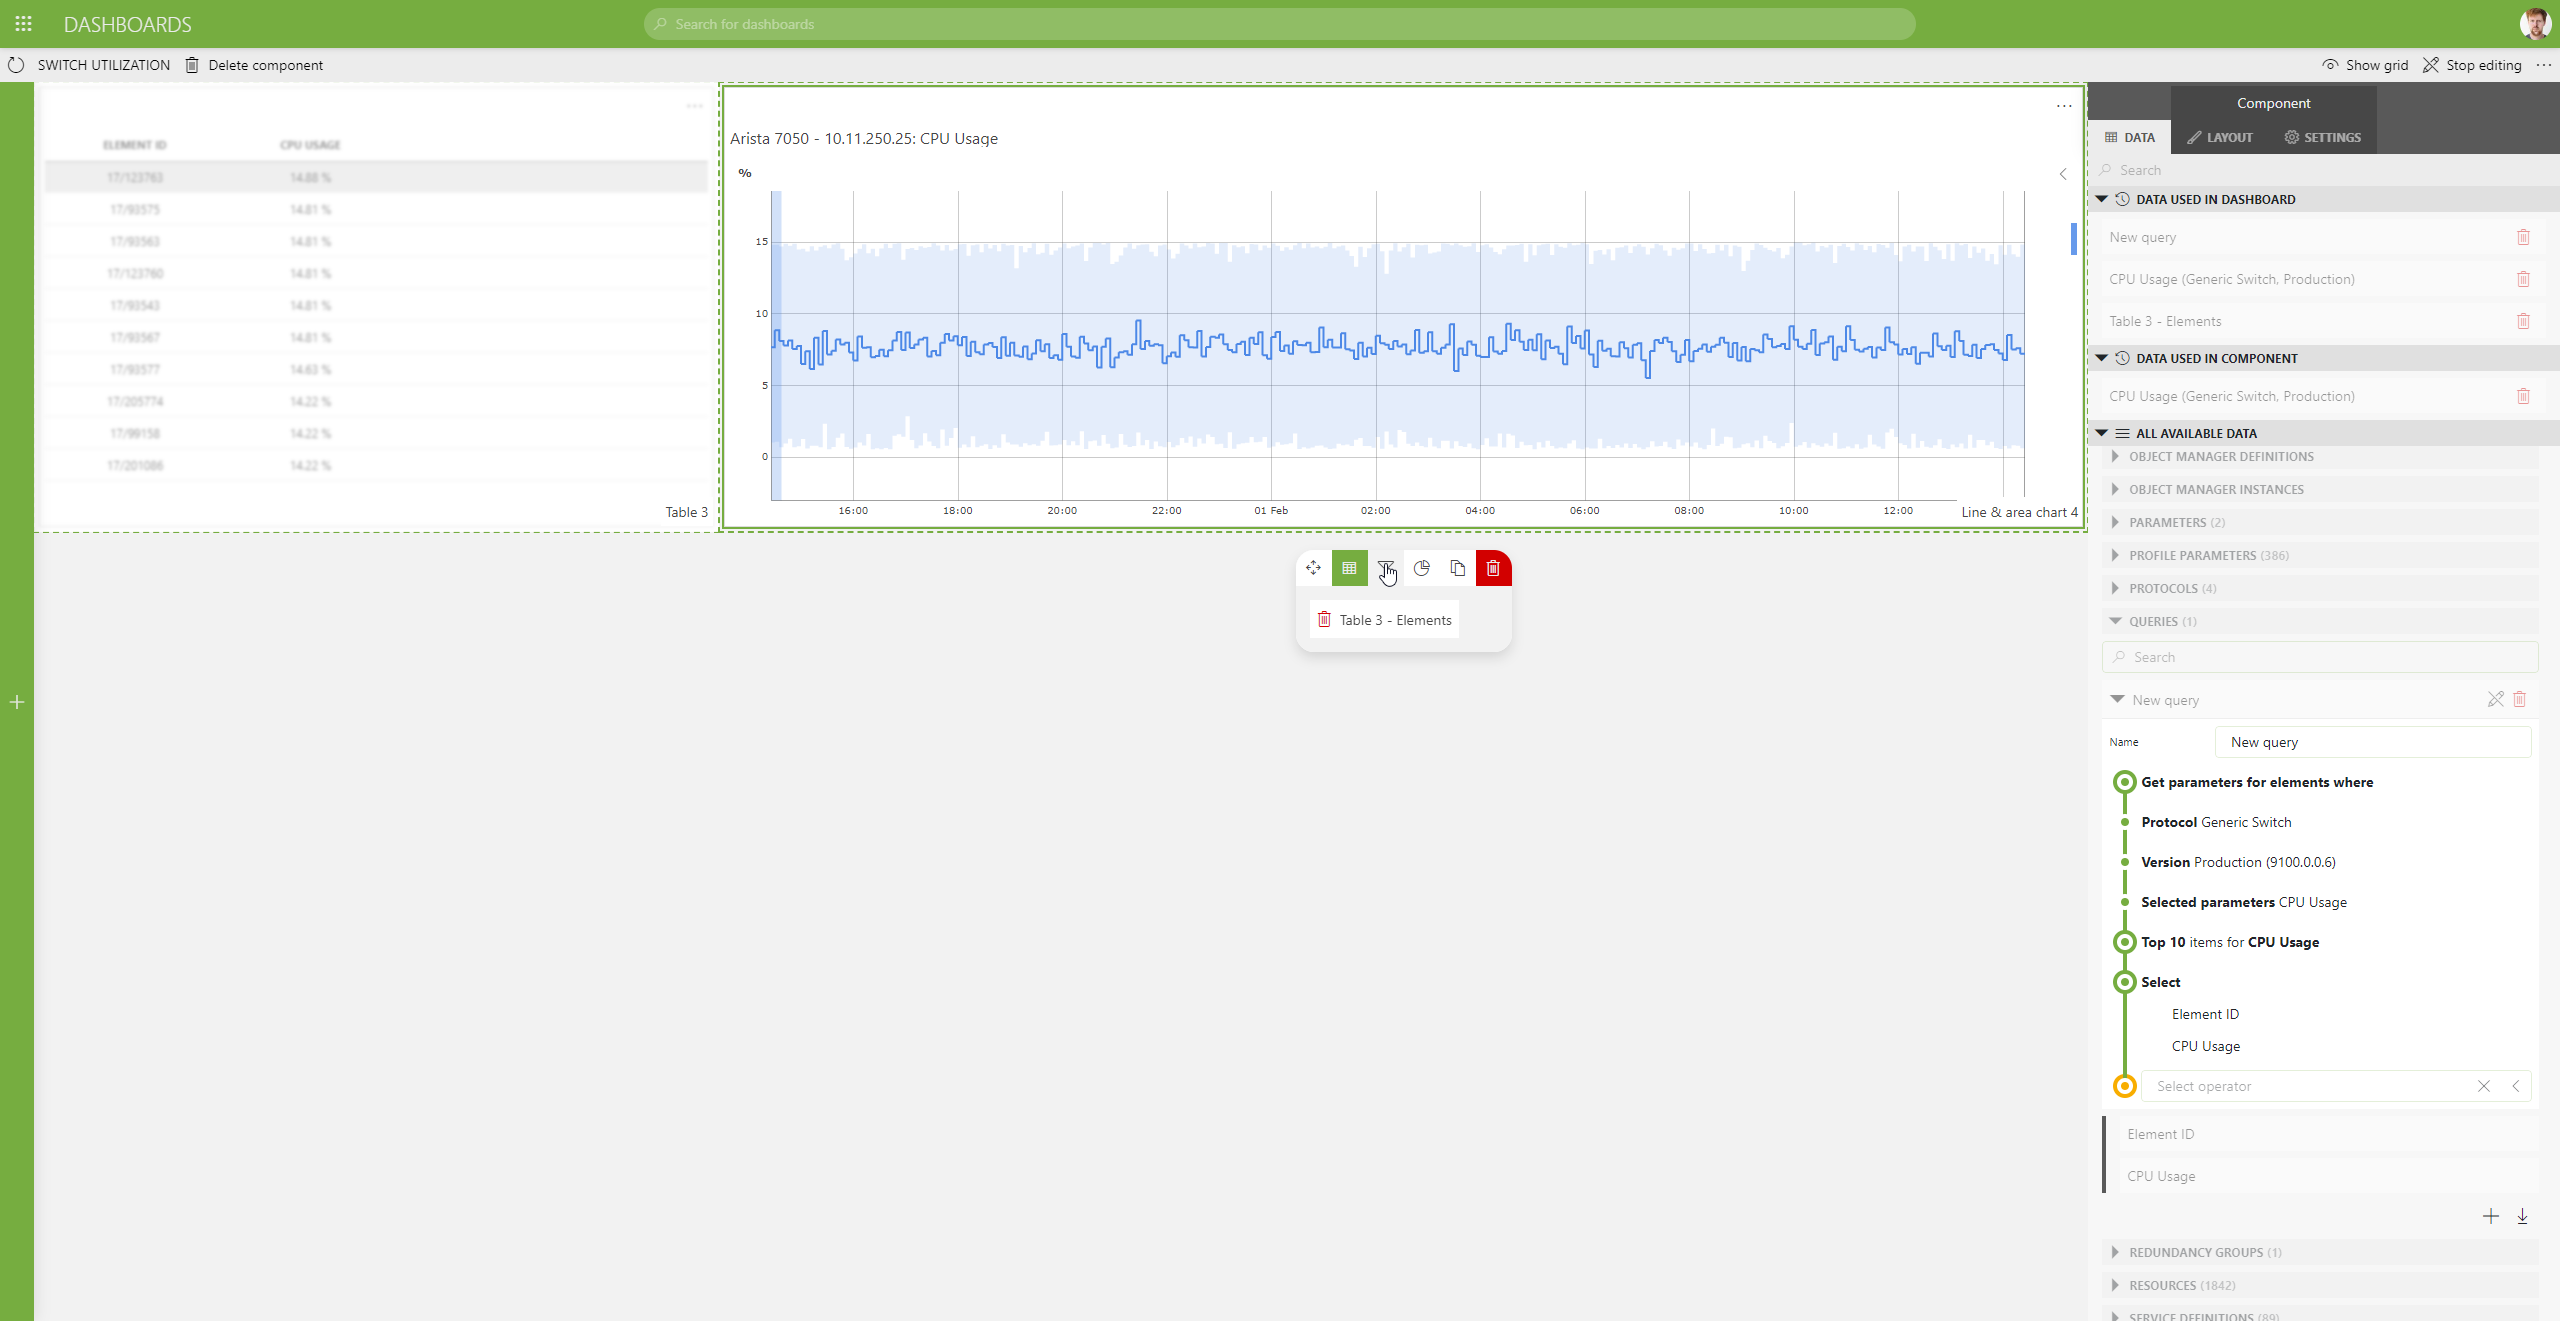
Below a quickly fetched example where I use a table in combination with a GQI query to show my top 10.

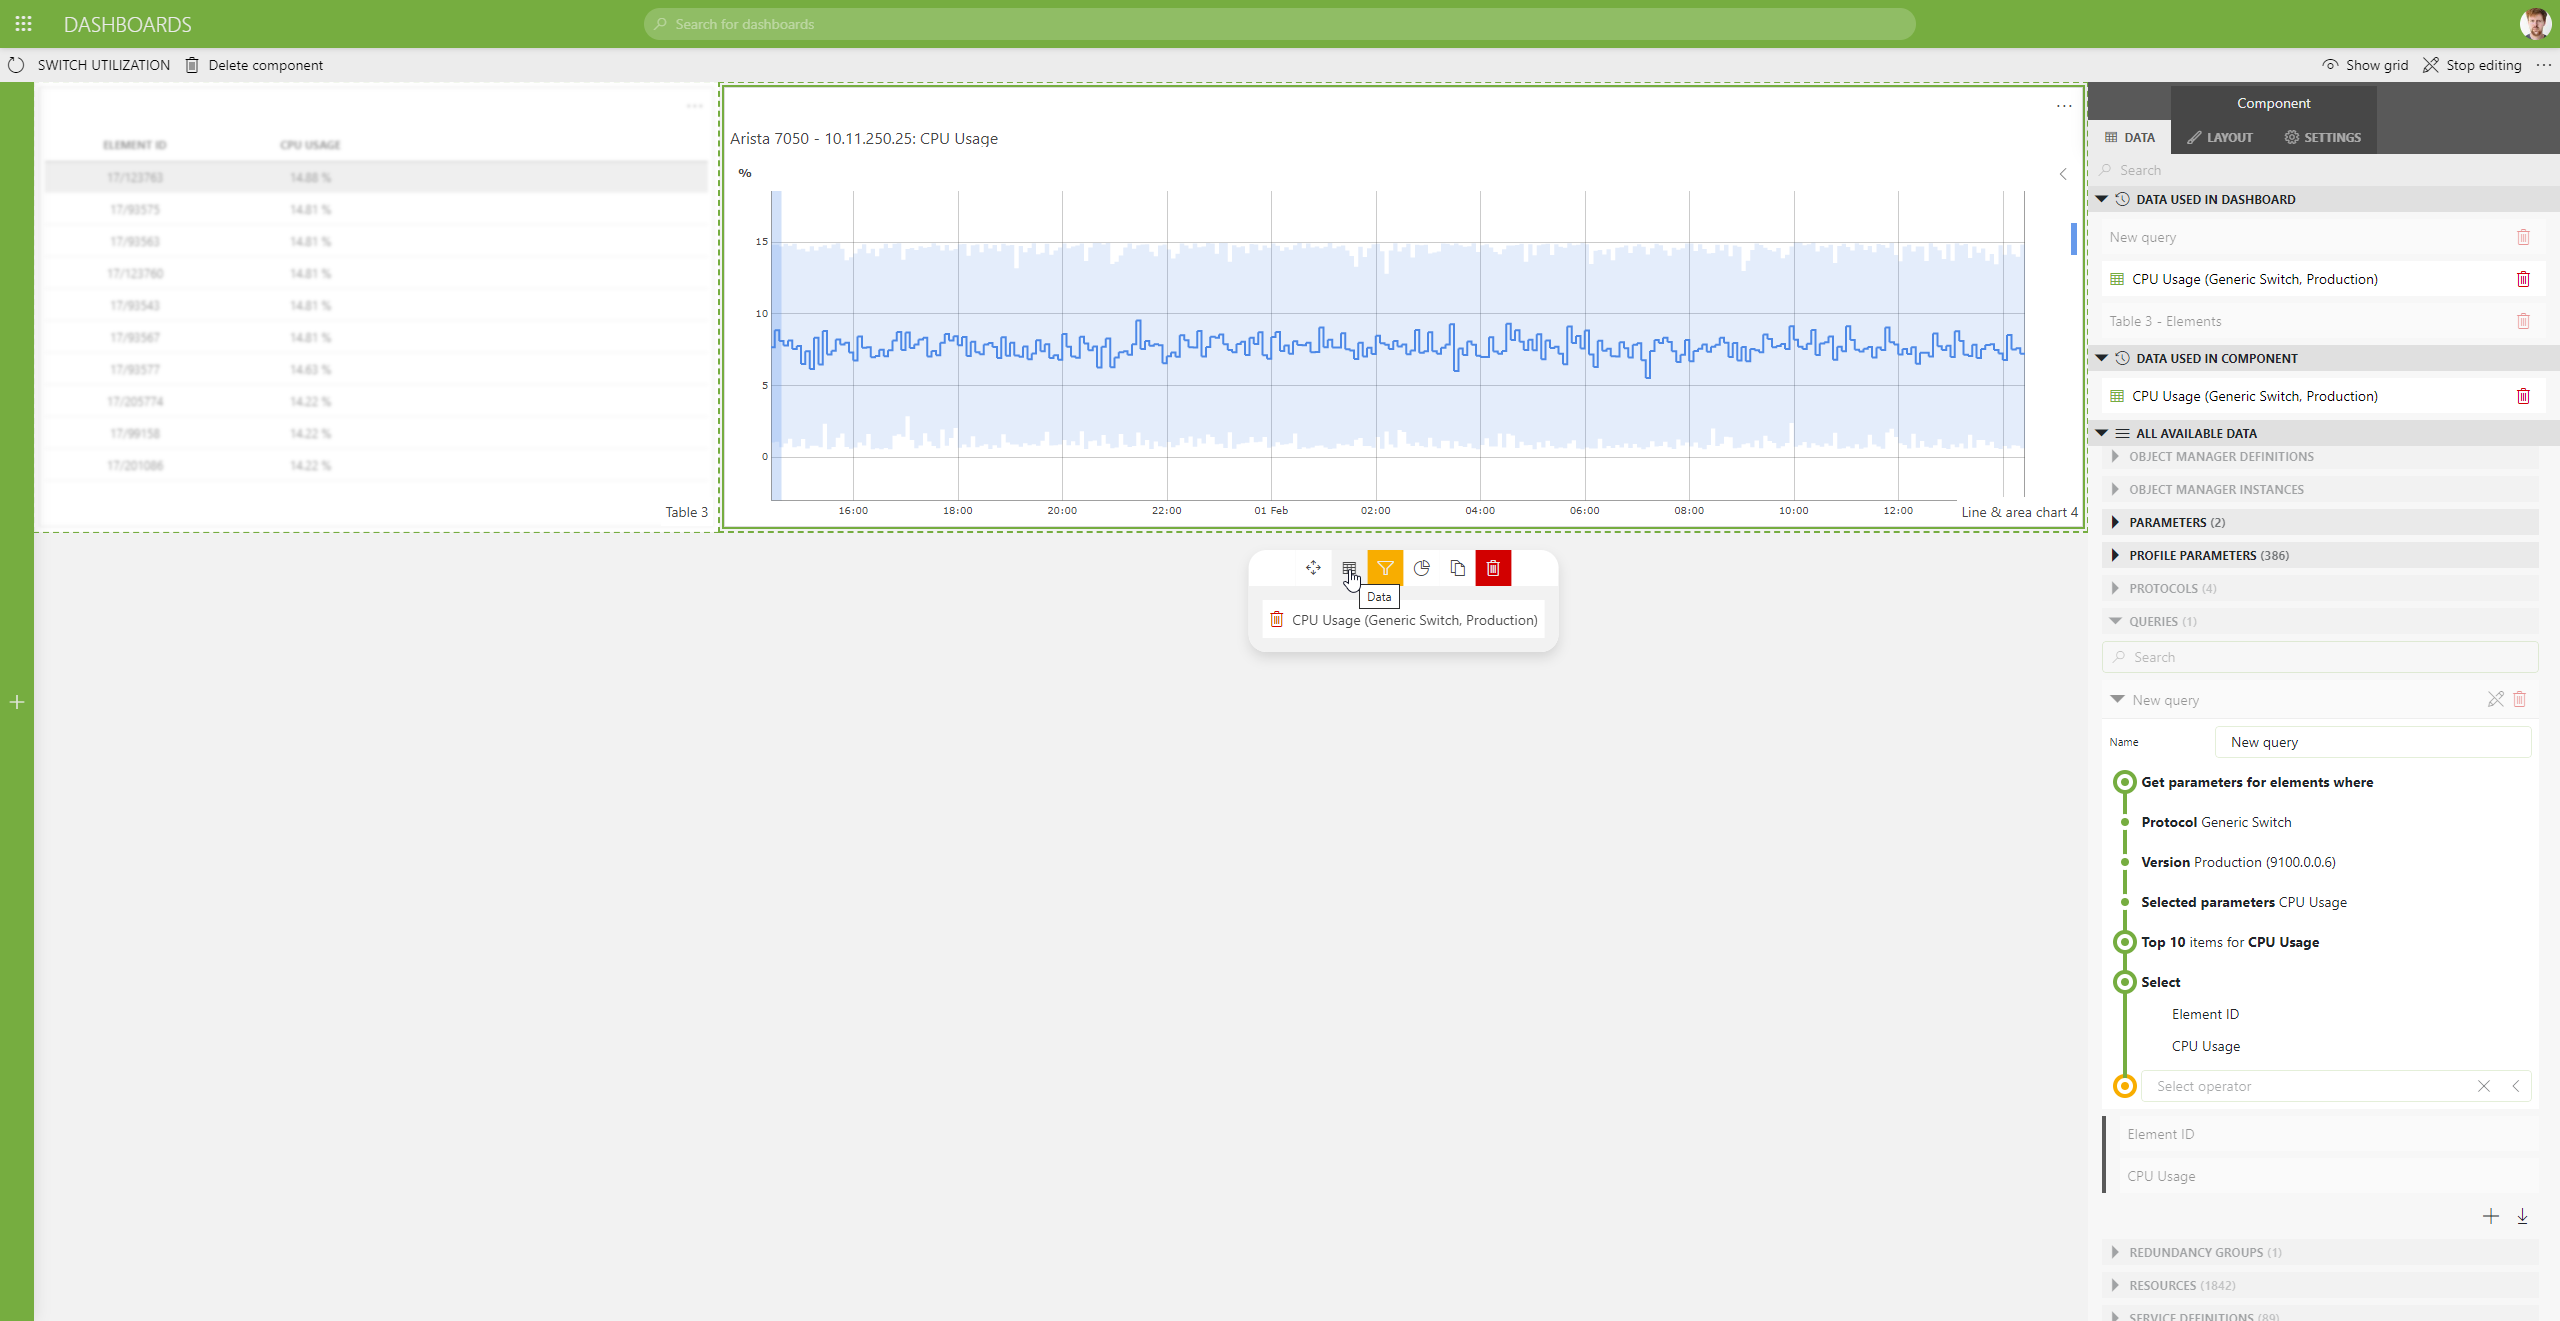
The selection from that table is used as feed for my line chart component to display the trend

