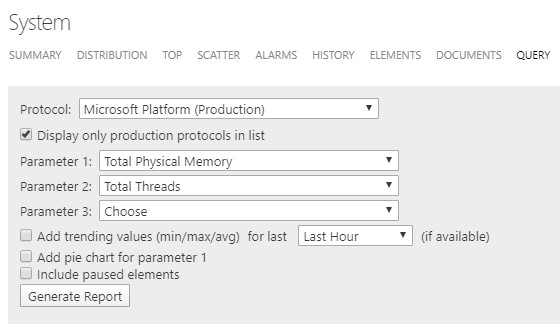
With the classical Reports & Dashboards module, it was possible to execute a simple query and to see a table that would give an overview of the selected parameter(s) in one table:

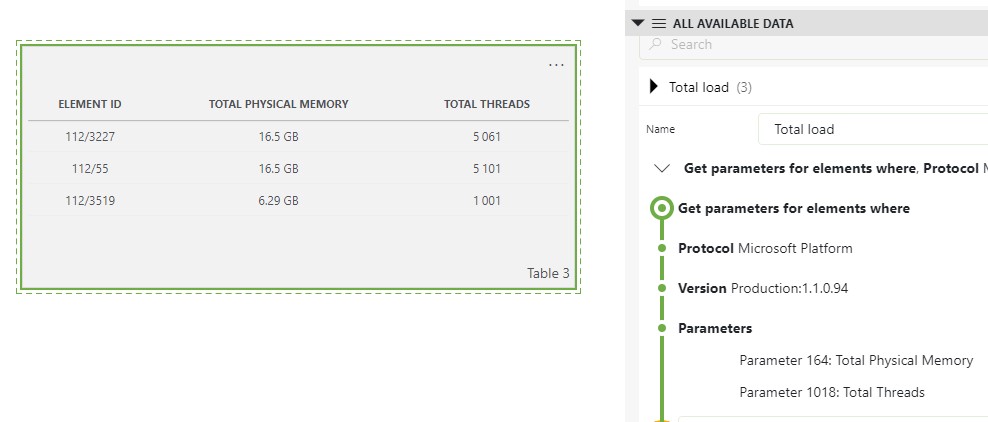
I'm trying to do the same thing with the new dashboards module. The closest I could get is to use the "Query" data and specify the items like shown in the screenshot:

Type "Table 3" shows the element id instead of the element name, other types like "State 3" shows a GUID.
-How can the element name be shown in the table? I tried to add "column manipulations" but that doesn't seem to show how to get to display the element name
-The classic report module had the option to select to add trending values (min/max/avg), is that also possible with the new dashboard data query? Or am I using the wrong component and is there an alternative available to easily have the same query functionality like the classic reporter has?
Hi Laurens,
For the first question, you can extend your query using an inner join with 'Get Elements'. The join should be done based on Element ID:
- Add the following entry to your query: Join (Type Inner)
- In the next entry 'Filter' select 'Get Elements'
- In the next entry choose 'Select'. For your use case, you only need to select the columns 'Element ID' and 'Name'
- In the Join entry, select as filter (in both fields) 'Element ID'. You will see the Element ID and name displayed in the table.
- (Optional) in the next entry, choose 'Select'. This will allow you to choose which columns are displayed in the table. Keep in mind that you can also manipulate the order to the columns

For the second question, there is a feature available from 10.1.4 to retrieve historic data (including min, max and average values) from queries. However this feature is only available for table parameters. Additional information can be found in RN29121