

Hi Experts,
I am working on creating reusable Service Templates for Rohde & Schwarz TMU9 DVB-T transmitters and would like some guidance on the best approach for alarm severity mapping in Visual Overview.
The TMU9 devices can have different transmitter configurations such as Dual-Drive, Single Tx, and 1+1. At the moment, I am working on the Dual-Drive configuration. because I have split this into 3 different service templates.
For Dual-Drive, I created one Service Template that generates one service per transmitter instance, for example:
Test.K2 Service
Inside the generated service, I have created separate service children for each visual component:
Test.K2 Service
<code>├── Exciter A - Main
├── Exciter A - Transmitter
├── Exciter B - Main
├── Exciter B - Transmitter
├── TX Controller - Main
├── TX Controller - Transmitter
├── PA Rack A
└── Miscellaneous

</code><img style="font-family: Verdana, Arial, Helvetica, sans-serif;" src="https://community.dataminer.services/wp-content/uploads/anspress-temp/ce1350bbaaeaefff9853b748122639136517db4e_11242.png" />
The Main children use the main TMU9 element, for example:
ABC.XYZ.CPE
The Transmitter children use:
ABC.XYZ.CPE.Transmitter A1
Each child includes only the parameters relevant to that component. For example, Exciter A - Main contains the Exciter A parameters from the main element, while Exciter A - Transmitter contains the relevant Exciter A parameters from the Transmitter A1 element.
This part is working correctly, and I can see the individual child elements and their alarm states when I open the generated service.
The challenge is with the Visual Overview alarm colouring.
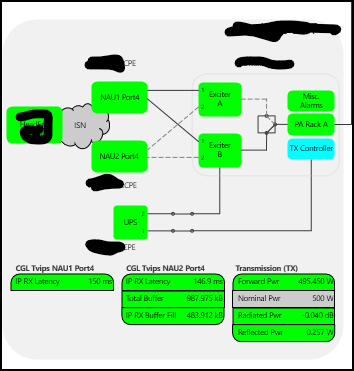
For the Exciter A box, I want the colour to represent the highest alarm severity between these two service children:
Exciter A - Main
Exciter A - Transmitter
My question is: Is there a supported way in Visual Overview to take the highest alarm severity of two service child elements/aliases within the same ServiceContext and use that result to automatically colour a single shape?
OR
Is there a better recommended Service Template / Visual Overview design for this use case that keeps:
- one generated service per transmitter instance,
- component-specific alarm scopes,
- one Visual box per component,
- and minimal maintenance when parameters change?
Any guidance or examples would be appreciated.
Visual Overview:

Hi Jain,
In this case, I believe you will need to create a service that includes both “Exciter A - Main” and “Exciter A - Transmitter” so you can display in a sharp the aggregated alarm of both elements.
There is a data shape in Visio that can be used to display the alarm severity of an individual element while taking the service context into account. See ServiceContext for more information.
However, as far as I know, it is not possible to use a single shape to aggregate the alarm severity of both elements while also taking the service context into account.
Hope it helps.
Thank you Miguel for your response it helps me.