I am trying to understand why there is a vast difference with alarms when you apply history tracking and with history tracking enabled, it condenses the alarms down to just 4 per instance?
If it is the same alarm that is coming and going (due to rain fade in this case) there were some 67 alarms. Once history tracking was applied as a filter, the alarm count had reduced to just 16.
This has caused some confusion and misdiagnosis of faults as there were clearly more alarms to indicate there was an issue onsite.
Does anyone else experience the same kind of filtering in Cube?
I’m asking this because we still have users on System Display (Plan is to migrate them over very soon and upgrade) who have been interpreting alarms a particular way in System Display and moving over to Cube is displaying or highlighting alarms very differently which is probably why the current operators a hesitant to move over.
To remove the 5 alarms per parameter limitation, please adjust the MaintenanceSettings.xml > AlarmSettings > AlarmsPerParameter from a value of 5 to a value of 100 (default). This will allow Cube to display up to 100 alarm updates per parameter. As an example, I have already implemented this change on the T01 server pair.
Thanks Michiel and Michaël!
Hi Nathan,
In addition to the other answers, I compared the behavior between System Display and Cube.
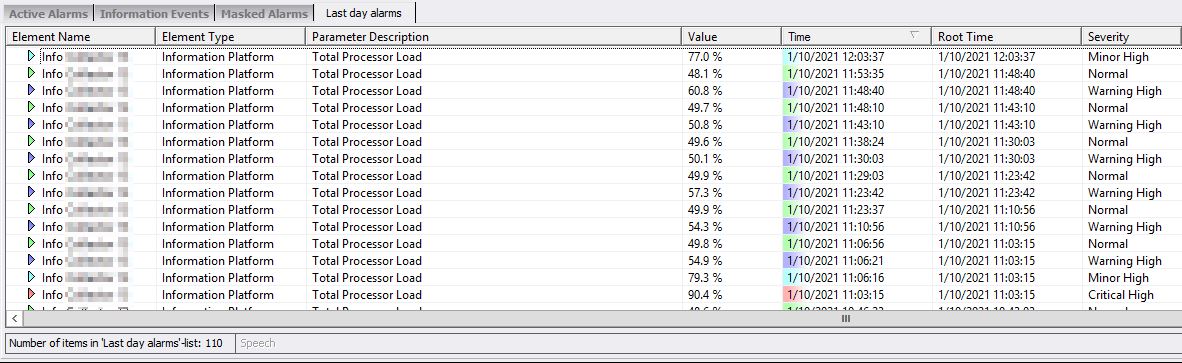
When requesting the alarm history with System Display, it’s showing all alarms by default without history tracking, as can be seen below it’s showing that there are 110 alarms in the list:
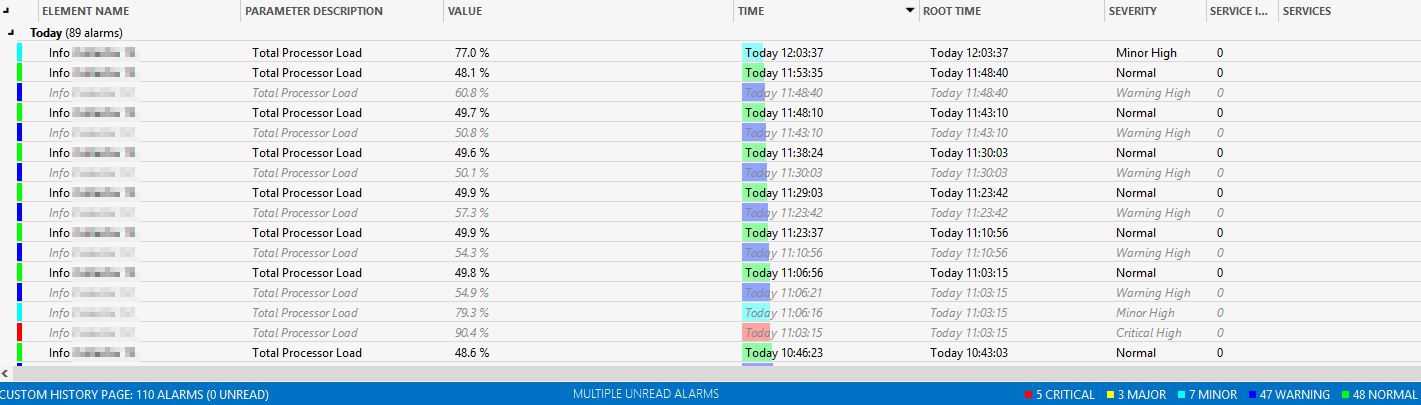
When requesting the alarm history with Cube, it’s also showing all alarms by default without history tracking. As can be seen below it’s also showing the same 110 alarms in the list:
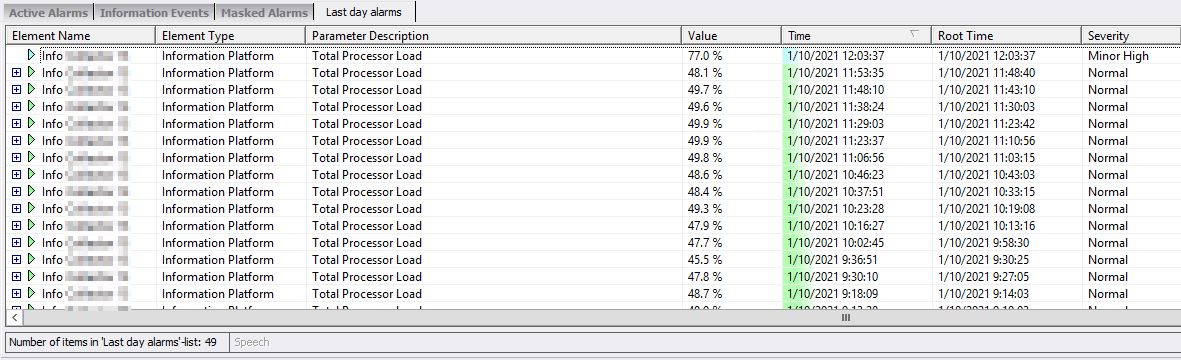
When activating history tracking in System Display, it’s grouping the alarms and show now that there are 49 alarms:
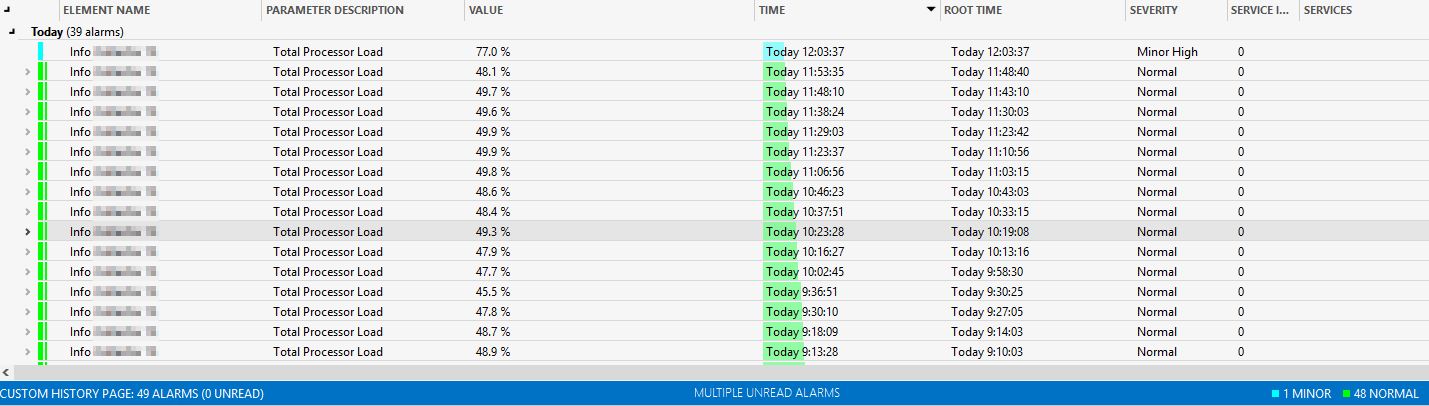
When activating history tracking in Cube, it’s also grouping the alarms and show the same thing like in System Display with the same count of 49 alarms:
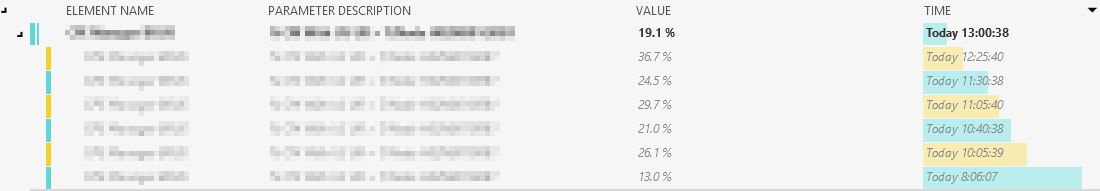
I also checked if it’s possible to see more than 4 entries per alarm group and I can confirm that this is possible. In below example I have an instance that contains 6 children:
Do note when an alarm clears (goes to normal severity) and later on a new alarm is raised that this will be considered as a new instance.
To summarize: I see no difference in the behavior between System Display and Cube. Both show the same alarms and have the same default settings for history tracking. I also see no limit by default in the number of children of an alarm history track, going above 4 seems possible (I checked both the active alarms tab page and also a history tab page).
*Note that the default behavior to always open an alarm console tab with or without history tracking active can be changed in the settings.
Hi Nathan,
History tracking is a feature which combines all the alarms records related to the same alarm together in one entry in the UI. This single entry can then be expanded to see all the underlying entries.
An alarm can start as a warning alarm, further escalate to a critical, and other actions like masking or ownership can also be executed on an alarm. This is all part of the history or life cycle of an alarm.
In the active alarms tab of the alarm console, this is activated by default. If you fetch history alarms, this feature is by default disabled so that you can see the individual records more easily. But it can be enabled or disabled easily in the hamburger menu on the upper left-hand side of the alarm console.
I believe the history tracking in System Display works in the exact same way, but maybe it is by default enabled in history tab pages, not sure about that anymore.
The transition from System Display to Cube should be very smooth as this works in the same way…
Let us know if you have any additional questions or concerns.
Thanks Ben!
Great information!
Hi Nathan,
The idea of the history tracking is that alarms on the same element/parameter/index combination are grouped.
These groups can be expanded to show all the alarms on that element/parameter/index. In that case the groups are counted, and it is indeed possible that the alarm count goes from 76 down to 16 if there are on average about 5 alarms in each group.
In this case it is up to the operators to expand the groups and look at all the alarms included in the group.
If this behavior is not desired it can be disabled from the alarm console menu, or it can be enforced from the user group settings.
Great Answer and clarification Michiel!
Thanks for your response Laurens.
This is great feedback!