Skip to content
DataMiner DoJo

More results...

Generic selectors
Exact matches only
Search in title
Search in content
Post Type Selectors
Search in posts
Search in pages
Search in posts
Search in pages
Log in
Menu
  • Updates & Insights
  • Questions
  • Learning
    • E-learning Courses
    • Empower Replay: Limited Edition
    • Tutorials
    • Open Classroom Training
    • Certification
      • DataMiner Fundamentals
      • DataMiner Configurator
      • DataMiner Automation
      • Scripts & Connectors Developer: HTTP Basics
      • Scripts & Connectors Developer: SNMP Basics
      • Visual Overview – Level 1
      • Verify a certificate
    • Video Library
    • Books We Like
    • >> Go to DataMiner Docs
  • Expert Center
    • Solutions & Use Cases
      • Solutions
      • Use Case Library
    • Markets & Industries
      • Media production
      • Government & defense
      • Content distribution
      • Service providers
      • Partners
      • OSS/BSS
    • Agile
      • Agile Webspace
      • Everything Agile
        • The Agile Manifesto
        • Best Practices
        • Retro Recipes
      • Methodologies
        • The Scrum Framework
        • Kanban
        • Extreme Programming
      • Roles
        • The Product Owner
        • The Agile Coach
        • The Quality & UX Coach (QX)
    • DataMiner DevOps Professional Program
      • About the DevOps Program
      • DataMiner DevOps Support
  • Downloads
  • More
    • DataMiner Releases & Updates
    • Feature Suggestions
    • Climb the leaderboard!
    • Swag Shop
    • Contact
    • Global Feedback Survey
  • PARTNERS
    • All Partners
    • Technology Partners
    • Strategic Partner Program
    • Deal Registration
  • >> Go to dataminer.services

High CPU usage blocking CUBE in Azure VM: what’s the best way to troubleshoot?

Solved851 views6th July 2023adl2099 Azure VM Cube high cpu usage
6
Alberto De Luca [DevOps Enabler]4.58K 20th March 2023 0 Comments

Hi Dojo,

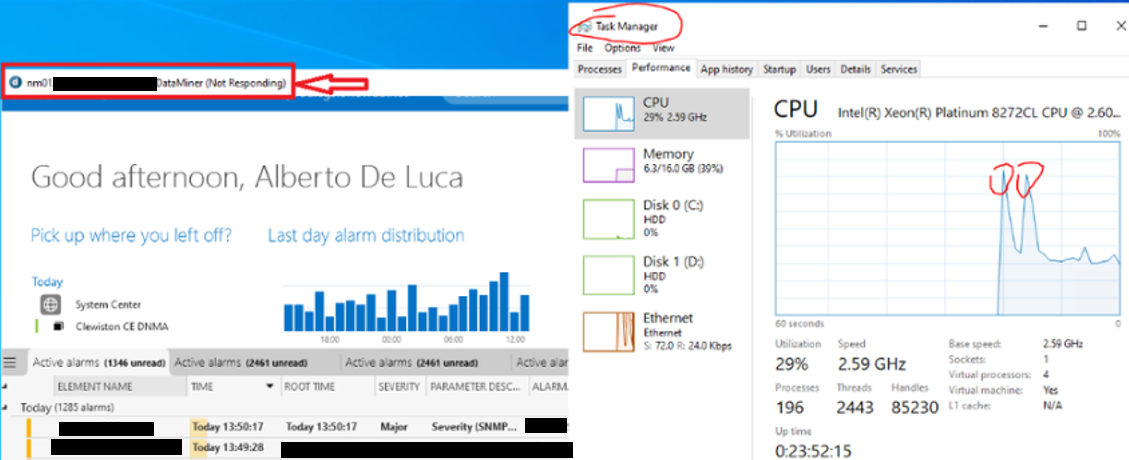
I'm troubleshooting an enterprise-scale installation of CUBE on Azure VMs - from the ongoing analysis, it seems that whenever a CPU spike is present on the VM, then DataMiner CUBE
becomes unresponsive:

the client gets stuck and a "Not Responding" message is displayed on the GUI of the desktop app

At times, it gets back nominal after 3 to 15 min, at times the app can crash, other times we just restart the APP to quickly regain control.

I'd like to determine if these CPU spikes on the VM are creating the "not responding" effect,
or if it is the other way around, with CUBE using 100% of one or more CPU cores for a long time, thus producing the spikes observed via Task-Manager.

My colleagues & I have come across this page:
https://docs.dataminer.services/user-guide/Troubleshooting/Procedures/Collecting_DataMiner_Cube_memory_dumps.html 

Please, what's the recommended type of dump to troubleshoot CPU performance issues?
Any specific settings to use?

In the past, we had an old DCP task: 181807 - I understand that a fix was applied in DM 10.2.7 to address CUBE performance when many cores are defined in the VM - we're now running DM 10.2.10.0, so I've assumed the fix is embedded, but wondering if this could be still related - any steer will be helpful.

Keen to understand if it is also recommended to run CUBE from a physical client to achieve better performance.

If there are any guidelines in terms of how a VM should be defined to better match what's required for CUBE, that would also help.

Thanks

Marieke Goethals [SLC] [DevOps Catalyst] Selected answer as best 6th July 2023

1 Answer

  • Active
  • Voted
  • Newest
  • Oldest
9
Bert Buysschaert [SLC] [DevOps Advocate]4.87K Posted 20th March 2023 1 Comment

Hi Alberto,

When Cube gets stuck with "application not responding", it can be caused by either a blocking call or deadlock (resulting in 0% CPU usage of the main thread), or by intensive processing (resulting in 100% CPU usage of the main thread). In both cases taking a few consecutive memory dumps (e.g. 3 dumps each 10s apart) with procdump -ma DataMinerCube.exe can be a good start for us to diagnose the root cause. If Cube recovers from the unresponsiveness, there may also be a stacktrace in the Cube logging ("freeze detection") that will point us in the right direction.

Another tool we use internally is JetBrains dotTrace, and using the command-line version to record a trace of Cube activity can be a next diagnostic step in the case of 100% CPU usage. You can get in touch with our team to assist with this.

I have no experience with Azure VMs, but a general rule with virtualization is that you do not always have a clear view on the overbooking of resources from within the VM, and activity in another VM on the same hardware may affect what a VM is capable of. Just like for servers, it may be interesting to run a benchmark tool like PassMark to gauge the real-world performance of the VM.

Marieke Goethals [SLC] [DevOps Catalyst] Selected answer as best 6th July 2023
Alberto De Luca [DevOps Enabler] commented 20th March 2023

Thanks for the prompt feedback, Bert

Will capture a few dumps of the type suggested and then get in touch with the support team

You are viewing 1 out of 1 answers, click here to view all answers.
Please login to be able to comment or post an answer.

My DevOps rank

DevOps Members get more insights on their profile page.

My user earnings

0 Dojo credits

Spend your credits in our swag shop.

0 Reputation points

Boost your reputation, climb the leaderboard.

Promo banner DataMiner DevOps Professiona Program
DataMiner Integration Studio (DIS)
Empower Katas
Privacy Policy • Terms & Conditions • Contact

© 2025 Skyline Communications. All rights reserved.

DOJO Q&A widget

Can't find what you need?

? Explore the Q&A DataMiner Docs

[ Placeholder content for popup link ] WordPress Download Manager - Best Download Management Plugin