

I have a script that goes through a large number of measurement points of a spectrum. See picture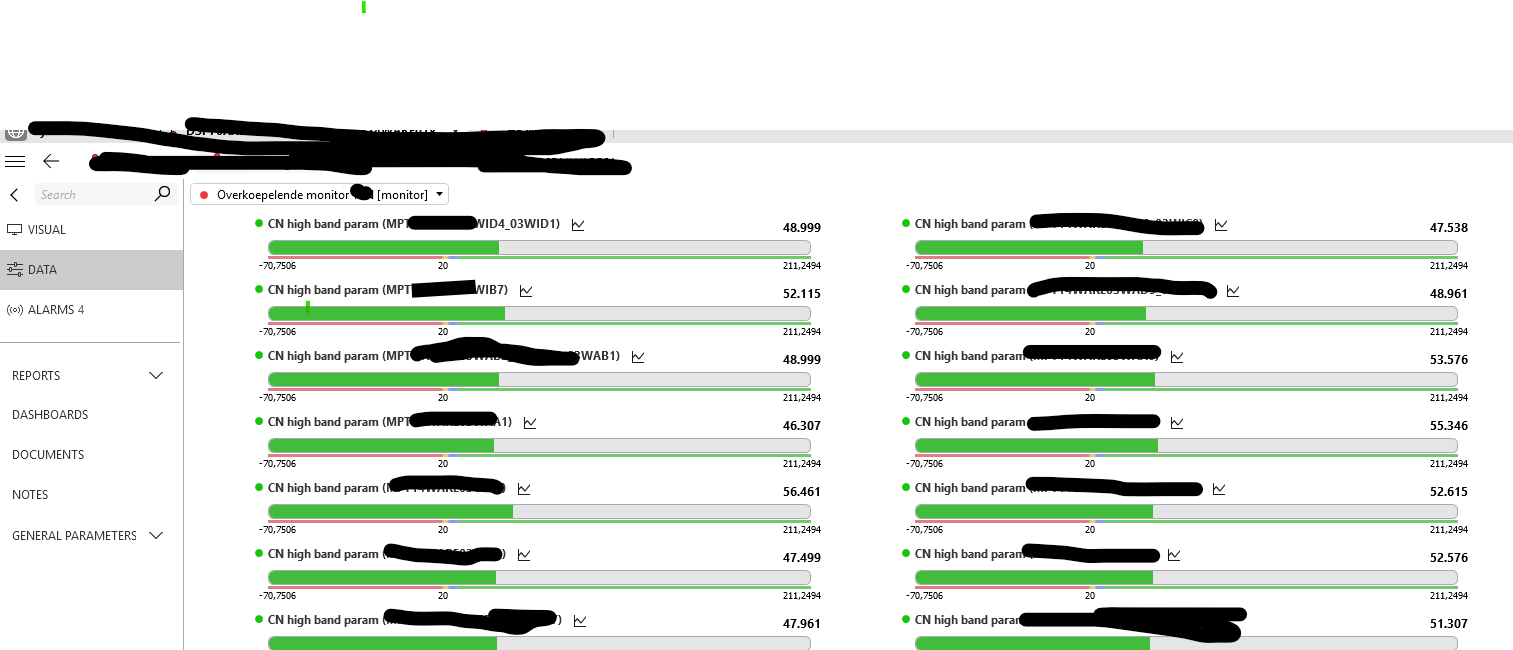 after which a monitor is created with the values. I would now like to display these values in a dashboard. Does anyone know how I can do this?
Miguel Obregon [SLC] [DevOps Catalyst] Answered question

Hi Tim,
When you define parameters for your monitors, they are exposed in Cube as single parameters (as shown in your screenshot).
To cover your use case, retrieving parameters across multiple monitors and spectrum elements would require, I believe the best approach is creating an ad-hoc data source that collects these metrics so it can be displayed in a table. From there, you can perform the required aggregation.
Hope it helps.
Miguel Obregon [SLC] [DevOps Catalyst] Answered question