I have a script that goes through a large number of measurement points of a spectrum. See picture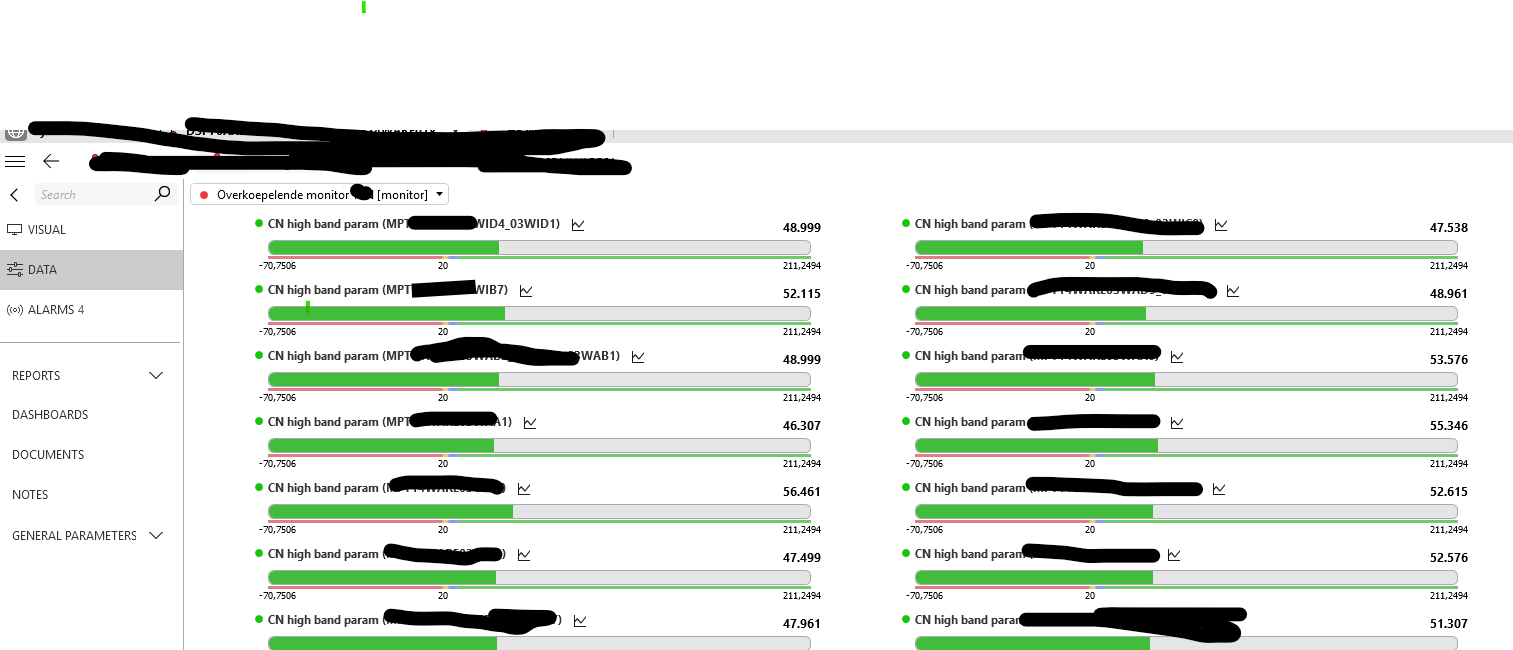 after which a monitor is created with the values. I would now like to display these values in a dashboard. Does anyone know how I can do this?
Miguel Obregon [SLC] [DevOps Catalyst] Answered question
It works for 1 element, I want to do it for this protocol. So I can count for example all: CN High, CN Low. Is it possible
Tim Eysermans Answered question