Hi,
Could someone please advise on how to display a single table column value with its current alarm state in a component in dashboard?
I have tried pulling in the column parameter from All Available Data -> Parameters -> From Service -> select the correct column, but I couldn't find any components to apply filters other than table component but table component isn't what I am looking for as I can't seem to edit the font size.
i.e. what I would want is to display a specific cell in a separate component with alarm status.
Could someone please advise if it's achievable and if it is, how? Thanks
As this question has now been inactive for a long time, I will close it. If you still want more information, could you post a new question?
Hi Paul,
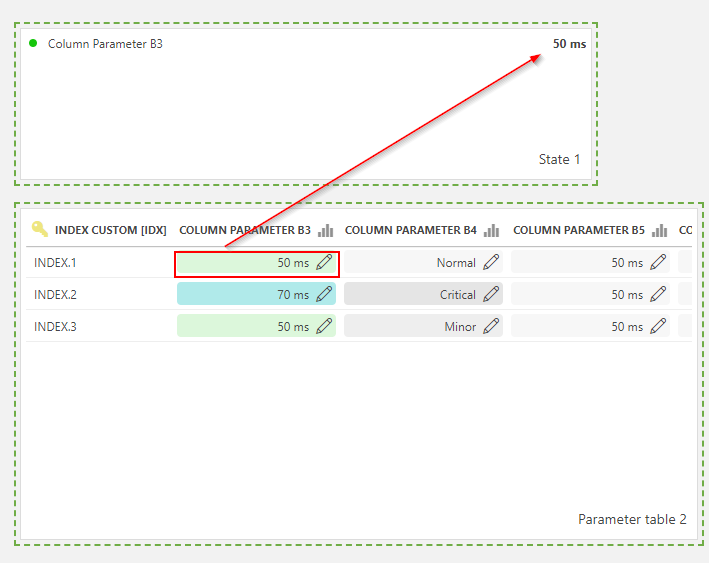
This should be possible. For example you could proceed as follows:
Component: Alarm state
Data Source: Parameters. Here you can choose the protocol name, protocol version and the parameter name (in your case the column parameter)
First filter: Element. Here you can use the element the contain the alarm that you would like to display
Second filter: Index. Here you can select Element ->Parameter -> The column index from the table -> the index
Below an example of the result:
 Hope it helps.
Hi Miguel, thanks for the info. Could you kindly explain where I can find first and second filter please? I can’t find them. I can only see ‘Show Units’, ‘Override dynamic units’ and ‘Group By’ options in Settings -< General section of the component. When I click the filter icon it just says there are no filters defined yet.
Hi Paul,
Please let us know if the screen recording provided by Randy covers your question.
Hi Paul,
I see that this question has been inactive for some time. Do you still need help with this? If not, could you select the answer that has been most helpful for you (using the ✓ icon)?