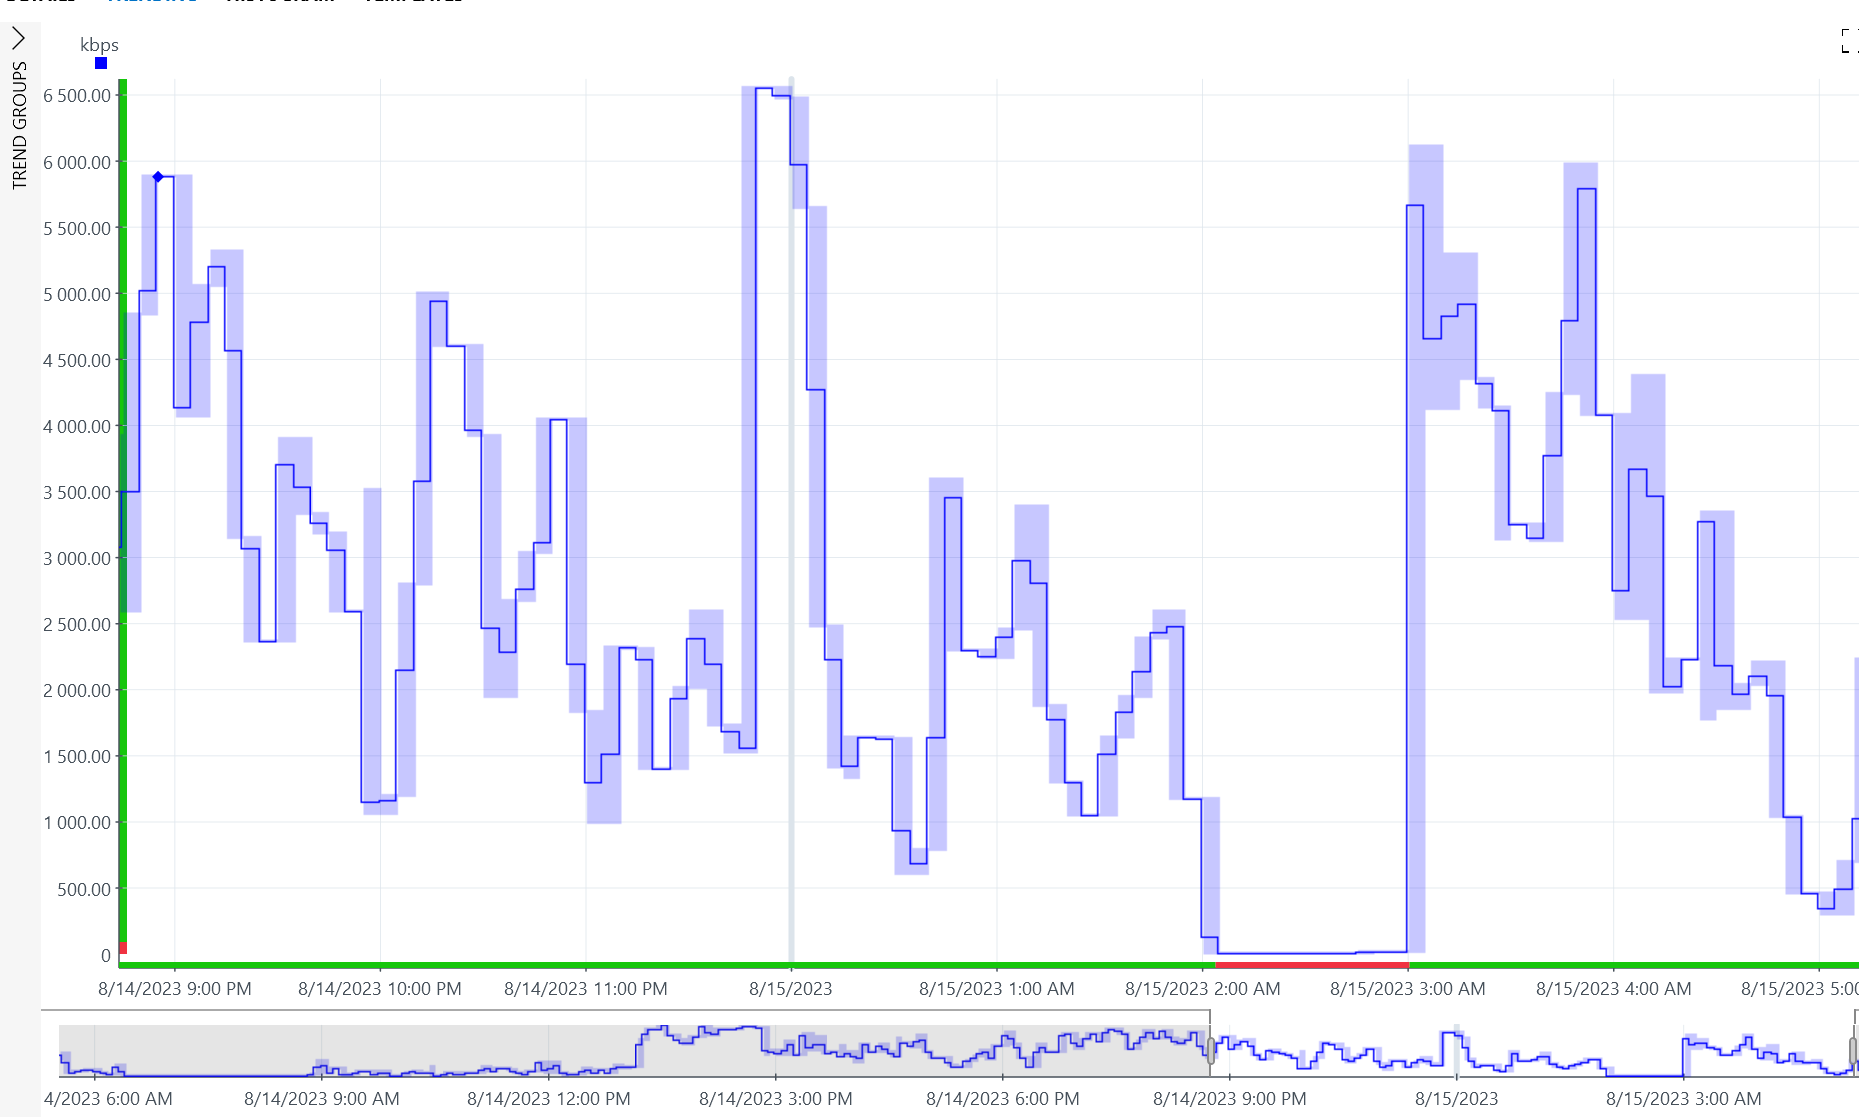
Question 1: Is there a way to display the baseline value from the trending graph at a specific point so that I can tell what is the precise baseline value during that time?
For example(screenshot above), there is an alarm triggered during 2 a.m. to 3 a.m. but I need to know what the baseline value are during that time so that I know if the alarm was generated correctly.
Question 2: Is there a way to have a trending graph of the baseline value so that we can set a proper alarm threshold according to the trended baseline value? For example, have a trending graph that displays the baseline value recorded from the last 24 hours.
Hi Zhing Hang Lee,
Nice to meet you!
In order to see the baseline, you’ll need some configuration in the connector of the element. You can use the following type attribute | DataMiner Docs to enable the smart baseline functionality for a given parameter.
<Alarm type="relative:NOMINAL_VALUE_PID,FACTOR_PID">
The NOMINAL_VALUE_PID is the one you’re looking for. This will contain the auto-calculated smart baseline and you can enable trending on this parameter. By doing this, you’ll be able to view the two trended parameters side by side.
Hope this helps you!
Kind Regards,
Jarno