Hi Dojo,
Is there any option to enable the client connection status in CUBE for DM10?
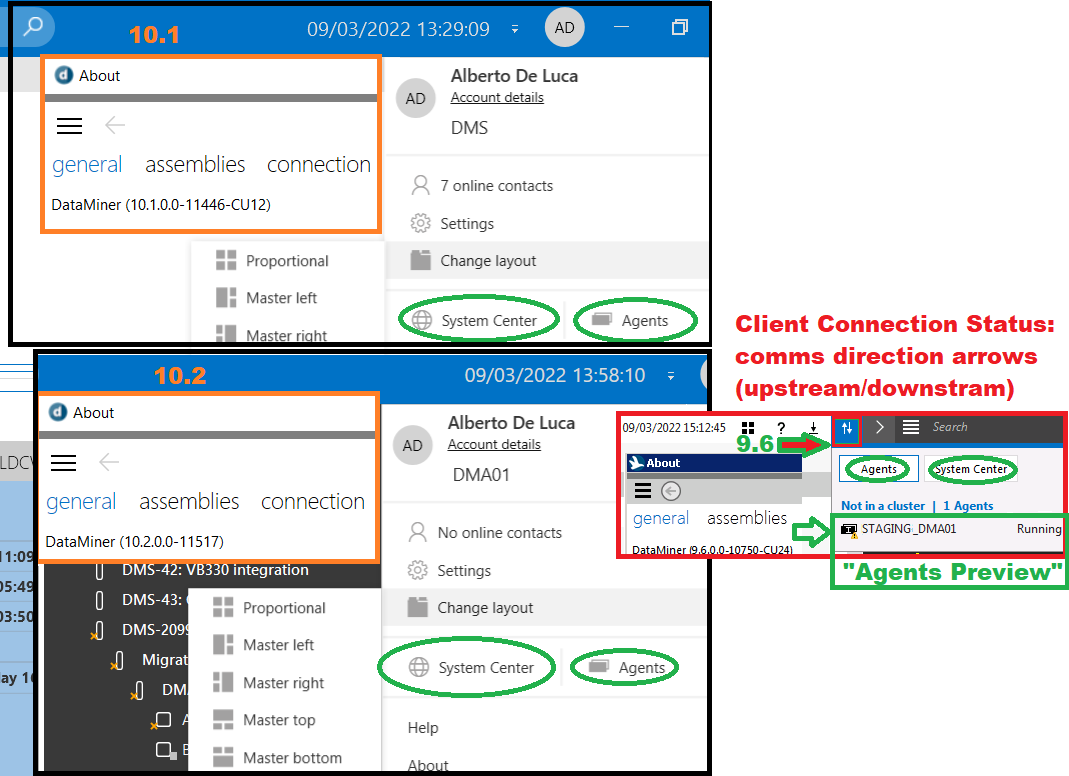
Cube in 9.6 used to have also a quick “preview” of the “Agents” easily accessible at one click, but I haven’t found a way yet to get this in CUBE for DM10 – some screenshtos below from 9.6, 10.1 and 10.2: the cliet connection status presented two arrows showing the direction of comms between clinet and server – is this available in a different area of CUBE now?
By default, “Agents” is available only as a short cut – but as an admin I’d like to rely on the quick preview if I need to quickly check the satus of the different DMAs in cluster while doing other configs: at present I can go to Agents, yet the preview was much quicker – any option to renable this preview too?

I was led to think that this had been implemented: see point 6 in the comment section of this old feature request, but if this is not the case are there any options to restore these shortcuts in full? Or Any workaround to customize the new GUI in a way that the old shortcurs are redundant?
Thank you
Hi Alberto,
Unfortunately, there’s no way to restore the Agents preview as this was completely removed. The best alternative is using the Agents tab in the System Center.
I’m actually also in favor of restoring this functionality and found this feature request. I’d recommend upvoting that feature request or contacting your Skyline contact for a new software feature request.
Alberto, can you elaborate on the comment ‘the client connection status presented two arrows showing the direction of comms between client and server’ please? Specially why do you need this, and what benefit this provides to the operators?
Please note that the feature requests you and Jens mentioned doesn’t have any reference to this arrow feature.
@Sri, this can ideally be traced within the training documentation that was avaialble up to 9.6?
Adding a separate answer as I cannot paste screenshots in comments…
With reference to this feature request, https://community.dataminer.services/new-feature-suggestions/bring-back-the-hamburger-please/
in the comments section a clear reference had been left also for the client connection status:
The “Client Conncetion” status referred above might be part of this:
Up to version 9.6, we could use this icon to receive an instant feedback on the actual presence of incoming data – it used to represent an UP arrow when the connection from the client was active and it showed a DOWN arrow for any incoming data stream (e.g. .Net eventing).
I used to rely on this as in the past it highlighted a couple of cases where data was no longer coming trhough and the client had to be restarted (especially useful for monitoring clients left running in a NOC environment). It also proved to be useful for those clients connecting in polling mode, as there was visual reference between polling (UP arrow) and receving the data.
The Arrows were related just to the comms between the client and the server used to connect to the cluster: in another occasion, 4-5y ago, I relied on this to prove to the firewall team that not all agents had been provided with the same connectivity (as no down arrow was shown when connecting to server 3 as opposed to server 1 and server 2).
In theolder Operator training, these were referred as the “Commnication Indicators” (p62)
Yes, you’re right, Jen – I had forgotten that one – well it seems it got some attention as well as the other feature request I have linked above – leaving the question open as it would be good to know if there is room for this in any of the upcoming releases or CUs for the main path.
Thank you