

I would like to create a dashboard that displays the minimum and maximum values of a parameter from a protocol table. Standard I get for 1 hour.
The table contains values for each RPD name, and I can retrieve all values per time interval (approximately every hour). I would like to analyze this data for the last 30 days.
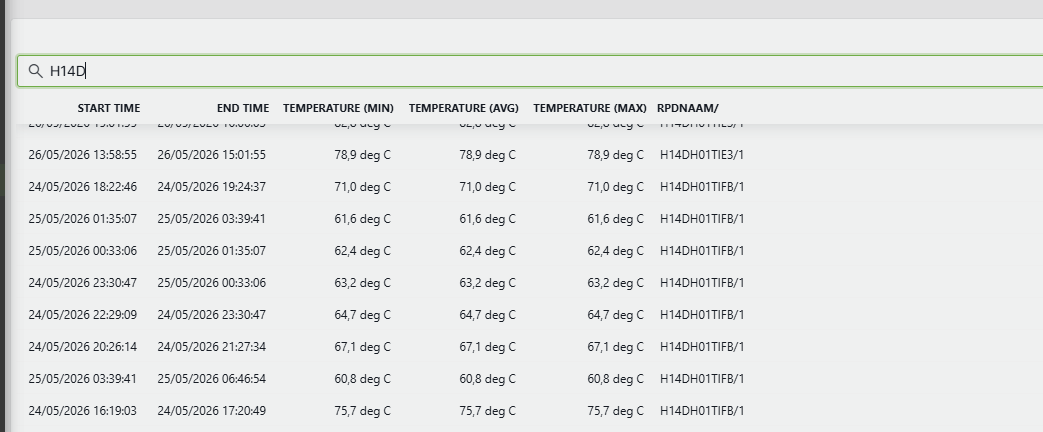
For example of this picture:
H14DH01TIFB/1: min= 60,8 and max= 75,7 and so further for another RPD's
Tim Eysermans Answered question