Hi all,
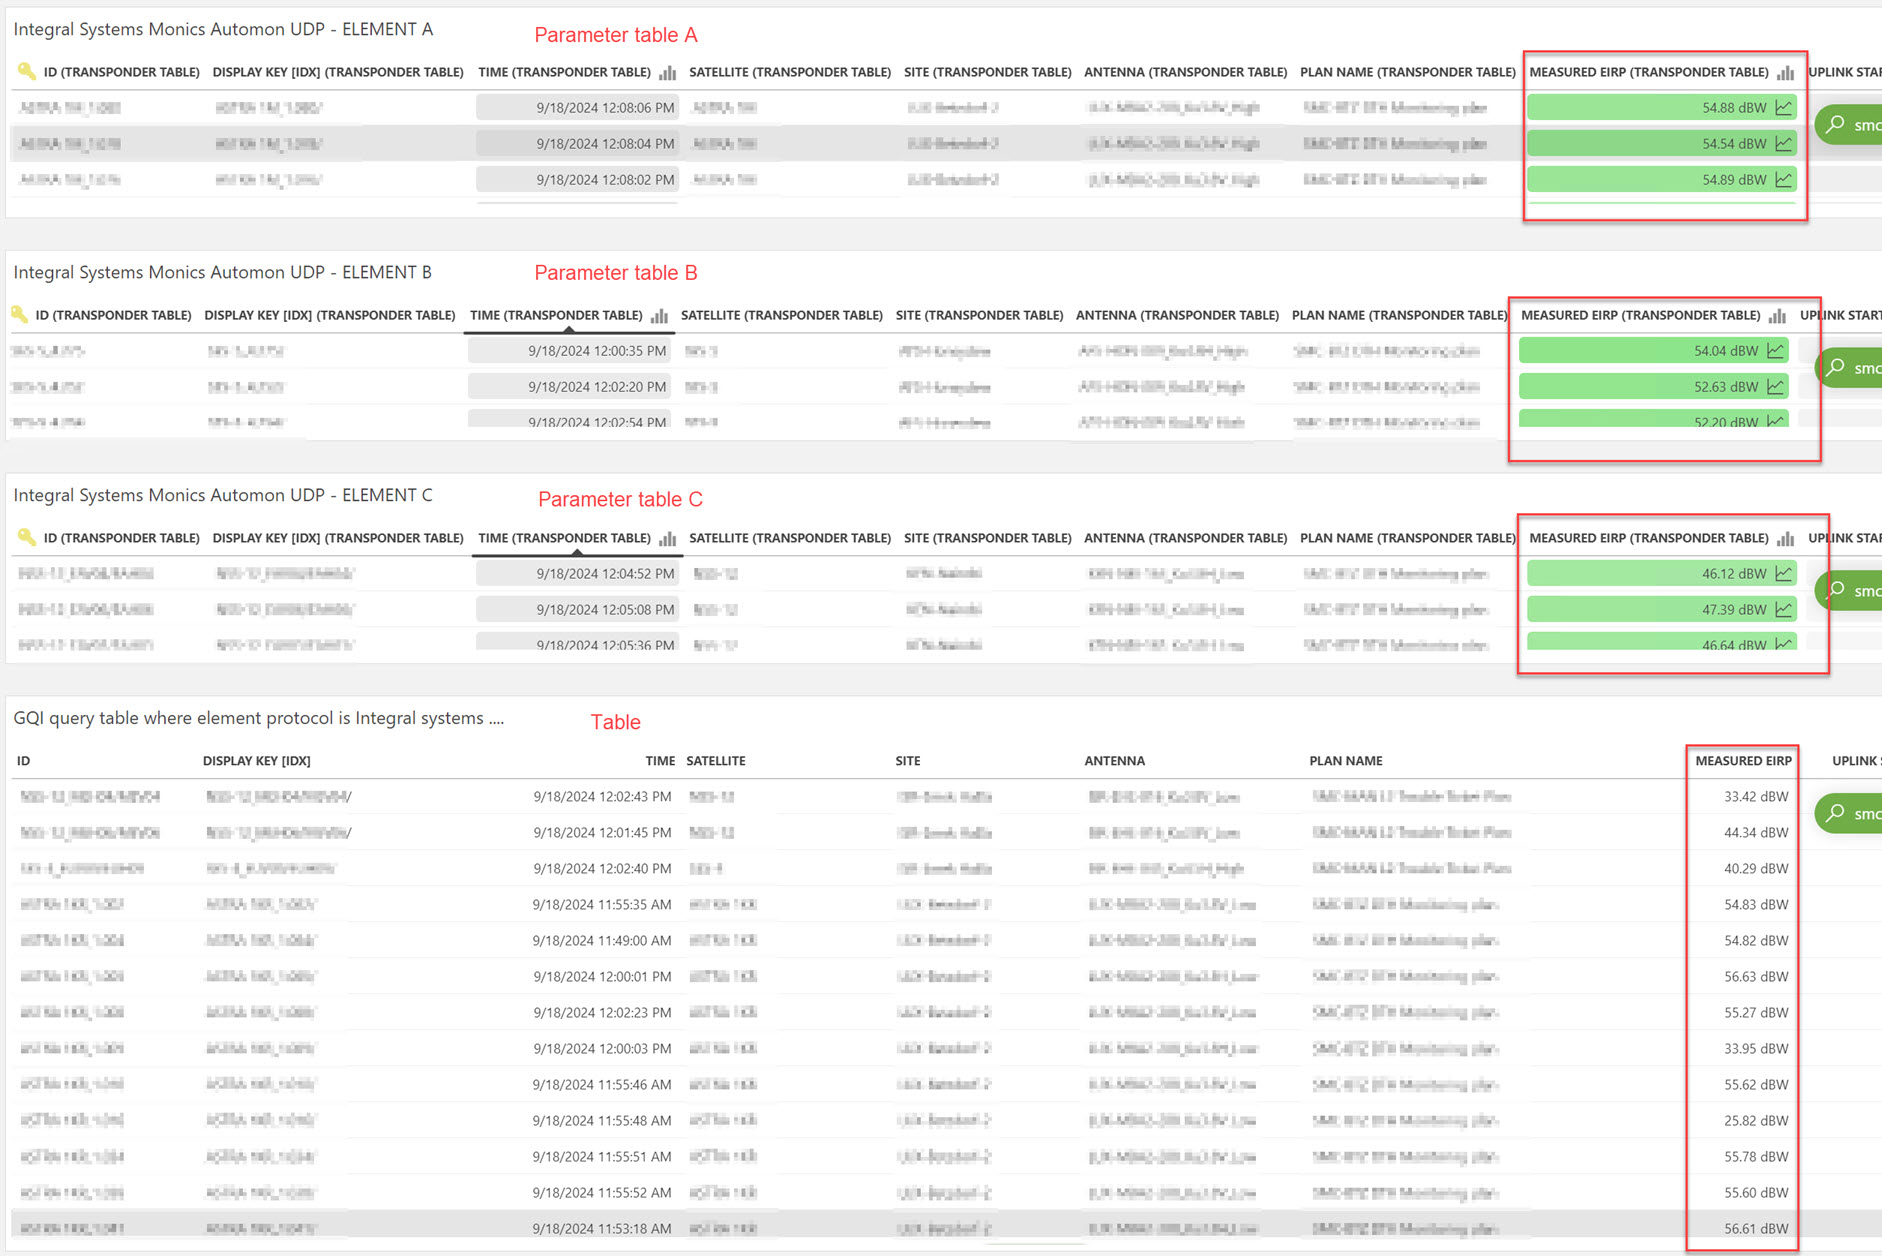
Is there a way in Dashboards to combine identical parameter tables from various elements of the same protocol and version into one big parameter table?
I am able to combine the data with a GQI query however the resulting table does not display the alarm severity on the parameter and I need that.
Hi Pedro,
I see that this question has been inactive for some time. Do you still need more information for this? If not, could you select Miguel's answer to indicate that the question is resolved?
As this question has now been inactive for a very long time, I will close it. If you still want more information about this, could you post a new question?
Hi Pedro,
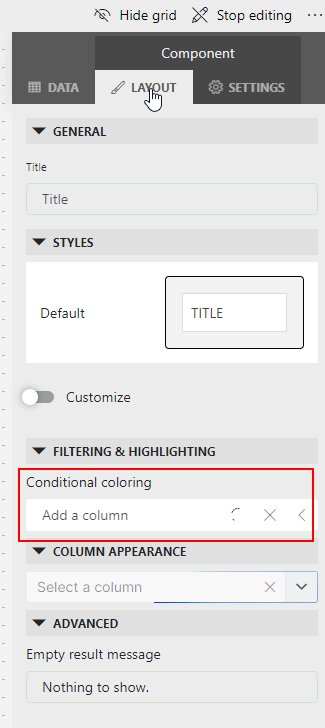
Indeed, I was planning to propose using GQI queries to display information from multiple element tables in a single one. However, as you already noticed, the table component used to display results from GQI queries is not able to display properties from the columns (e.g. trend icon, alarm severity). For severity, you could workaround this by using conditional coloring.

The drawback of this workaround is that you will need to define the thresholds manually. This means that if a threshold is updated in the alarm template assigned to these elements, the threshold defined in the dashboard will need to be updated as well.
Apart from coloring, you can customize the columns. There is a nice tutorial about this feature in DataMiner Docs (Styling a table component)
Hope it helps.
Hi Miguel,
We have multiple Integral Monics systems (Integral Systems Monics Automon UDP) around the globe monitoring satellite downlink traffic. The element has three tables, a carrier, a transponder and a beacon table that display the corresponding traffic type.
I want e.g. to create one single transponder table that will display all the transponders from all these elements with the corresponding alarm severity status.
In Dashboards, I am able to display the parameter tables for each element separately but I am unable to combine them. With a GQI query I can combine the information however I do not see the alarm severity status.

Hi Pedro,
Please could you elaborate a bit more about the relationship between displaying multiple parameters from the same protocol and the fact that you are not able to see display the alarm severity? If you let us know the protocol that you are using and the parameters that you would like to combine.
Thanks