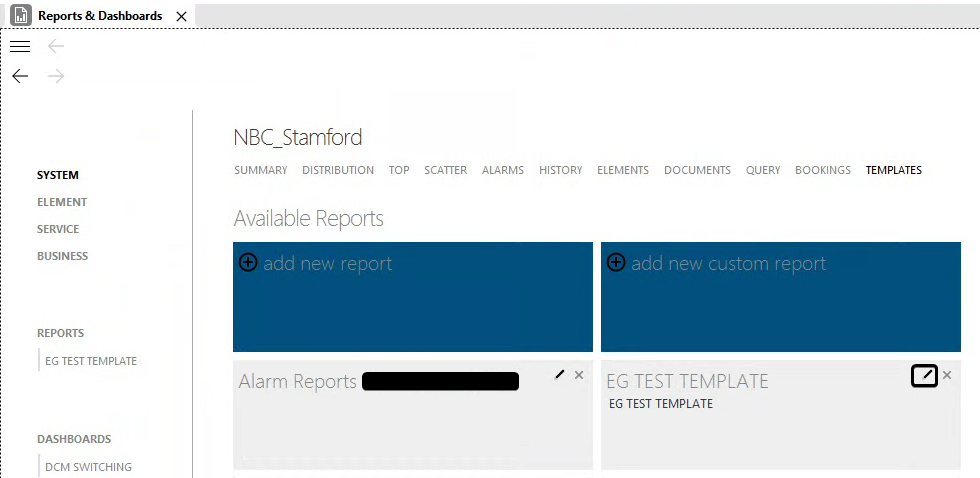
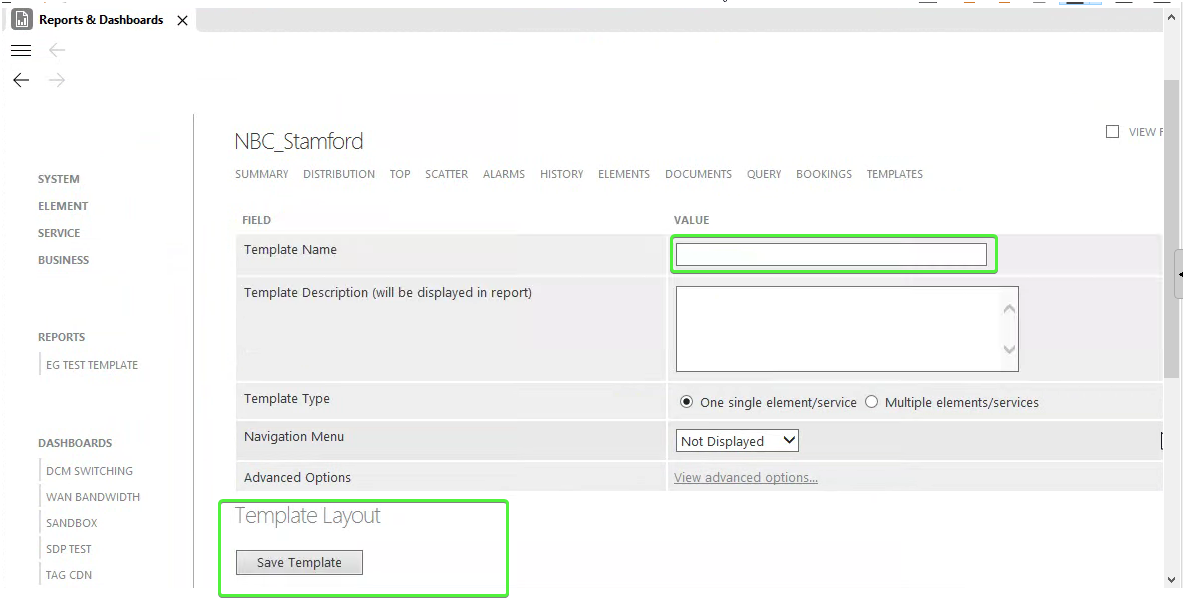
In the DMS (DataMiner 10.0.9.0-9385-CU1), Report and Dashboards is working propertly in only 1 of the 3 DMA's. The error is that not of the available reports can be edited (see the images below), after clicking the edit button (pencil) the template name is empty and the there is no template layout available to be added:

 In the SLASPConnection.txt logs there are errors related to DMS reporter not inializated or not updated:
2021/06/15 04:09:54.764|SLASPConnection.exe 10.0.2016.458|7576|6828|CRequest::Request|ERR|0|Remote Request for -Reporter- on -VT_I4 : 140602- failed. DMS Reporter is not initialized yet, or is currently updating it's data (hr = 0x800402BA)
Reports can be created in the DMA's with errors but CAN'T be edited from those DMA's. The report templates created in the DMA's WITH errors can be edited in the DMA with NO errors.
DMA's were rebooted recently due to monthly Windows updates.
DCOM config procedure for configuring 'Launch and activation permissions' was executed but the options were already correctly set.
In the DMA were Reports & Dashboards is ok there are no errors in the ASP log.
Hi Elbano,
Some hints that might help you debug this issue:
For the template editor, the template data is embedded in the page and the form fields/template layout is initialized through javascript code, which means you can check two things:
- Right-click the page and select "view source" (or similar). Verify that the details are in there. It's part of the head section and looks like "var strBuildInfo = htmldecode('GENERAL;#;1;#;Example;#;;@;AlarmDistribution;#;Alarm Distribution Graph;#;600;#;300;#;3;#;2;#;true;#;7;#;0');"
- Make sure you open the Report webpages directly (http://xxxx/Reports, not via Cube), navigate to the broken editor and open the developer console (F12 typically). The Console might show Javascript errors that could explain why the editor is not loading.
I don't believe there are server side errors involved (aside from missing files maybe), as navigating to the list of templates works.
Hi Wouter,
You’re right, it does’nt seems to be errors on server side. Reports and Dashboards are working normally opening it directly (to the 3 DMA’s IP addresses) but using Chrome (instead of IExplorer).
In the developer console in IExplorer these are the observed errors when Reports & Dashboards are accessed to 2 of the 3 DMA’s:
SCRIPT1010: Expected identifier
angular.min.js (81,257)
SCRIPT1010: Expected identifier
angular-reporter.js (20,26)
SCRIPT5009: ‘angular’ is undefined
angular-builder.js (2,1)