Skip to content
DataMiner DoJo

More results...

Generic selectors
Exact matches only
Search in title
Search in content
Post Type Selectors
Search in posts
Search in pages
Search in posts
Search in pages
Log in
Menu
  • Updates & Insights
  • Questions
  • Learning
    • E-learning Courses
    • Empower Replay: Limited Edition
    • Tutorials
    • Open Classroom Training
    • Certification
      • DataMiner Fundamentals
      • DataMiner Configurator
      • DataMiner Automation
      • Scripts & Connectors Developer: HTTP Basics
      • Scripts & Connectors Developer: SNMP Basics
      • Visual Overview – Level 1
      • Verify a certificate
    • Video Library
    • Books We Like
    • >> Go to DataMiner Docs
  • Expert Center
    • Solutions & Use Cases
      • Solutions
      • Use Case Library
    • Markets & Industries
      • Media production
      • Government & defense
      • Content distribution
      • Service providers
      • Partners
      • OSS/BSS
    • Agile
      • Agile Webspace
      • Everything Agile
        • The Agile Manifesto
        • Best Practices
        • Retro Recipes
      • Methodologies
        • The Scrum Framework
        • Kanban
        • Extreme Programming
      • Roles
        • The Product Owner
        • The Agile Coach
        • The Quality & UX Coach (QX)
    • DataMiner DevOps Professional Program
      • About the DevOps Program
      • DataMiner DevOps Support
  • Downloads
  • More
    • DataMiner Releases & Updates
    • Feature Suggestions
    • Climb the leaderboard!
    • Swag Shop
    • Contact
    • Global Feedback Survey
  • PARTNERS
    • All Partners
    • Technology Partners
    • Strategic Partner Program
    • Deal Registration
  • >> Go to dataminer.services

Calculate average values for a trend

Solved1.71K views22nd September 2020trending
3
Arunkrishna Shreeder [SLC] [DevOps Advocate]4.03K 21st September 2020 0 Comments

Hi Dojo,

How are the average values for a trend calculated from the real-time values?

For example, I export the trend as CSV on a 5-minute interval (image below)

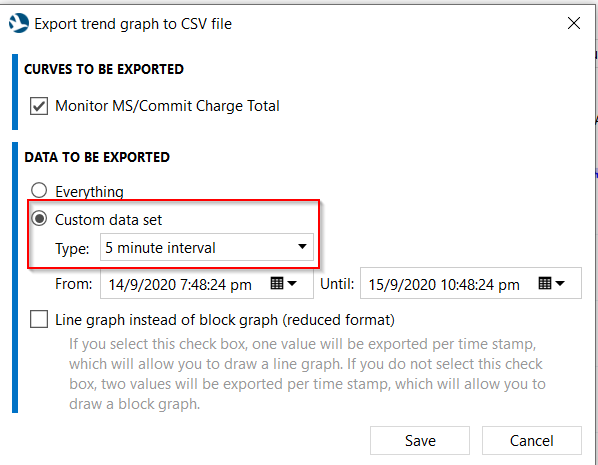
Similarly I obtain the real-time data.

If I compare the 5-minute interval CSV file’s values with that of the real-time values, I am not able to establish a relationship on how the averages are calculated.

Please can you teach me how the 5-minute interval averages are calculated (preferably with an example), thanks in advance.

Marieke Goethals [SLC] [DevOps Catalyst] Edited question 22nd September 2020

2 Answers

  • Active
  • Voted
  • Newest
  • Oldest
3
Toon Casteele [SLC] [DevOps Enabler]7.01K Posted 21st September 2020 0 Comments

I’m only aware of how we do this in DataMiner Cube for client side averaging, but as far as I know it’s supposed to function the same way for server side averaging.

For every time slot of 5 minutes (or whatever you have configured) a weighted average is taken of the real-time values. What I mean by weighted might become more clear if I give a fictitious example. Consider the following changes:

  • 01:00:00 -> value = 10
  • 01:04:00 -> value = 20
  • 01:07:00 -> value = 40

Because the value 10 lasted for 4 minutes within the first 5 min time slot and value 20 only lasted 1 minute in that interval (the end of the interval is 01:05:00), the average value of this point in the DB should be:

(10 * 4 + 20 * 1) / 5 = 12

The min value will be 10 for this slot and the max value 20.

Similarly you can make the same exercise for the next 5 minutes, where that should bring you to an average value of 32.

Arunkrishna Shreeder [SLC] [DevOps Advocate] Selected answer as best 22nd September 2020
3
Ruben Vandepitte [SLC] [DevOps Advocate]2.32K Posted 21st September 2020 0 Comments

In short, every 5 minutes DataMiner will write an entry into the database, containing the average, minimum and maximum of the real-time trend entries (= all unique parameter values) generated over the previous 5-minute interval. When you request an export, these entries are retrieved from the database, processed and exported as a CSV file.

Some things to check and questions to ask that might help you:

  • Using the SNetClientTest tool and/or by directly querying the database, you can check what the real-time and average trend entries look like, and if these would be different than the ones in the CSV export.
  • It is possible to modify the default trend windows and set a custom interval, so that the 5-min-avg entry is actually calculated over a longer or shorter time span than you might assume
  • Exception values are ignored by the average calculation, but I believe they are still exported in the real-time CSV file. If you manually calculate the average based on the real-time CSV export, you should exclude these as well.

In order to further assist, it would be useful to know what kind of anomaly you see. Do you get a small deviation from the expected average values, or do you get a complete mismatch?

Ruben Vandepitte [SLC] [DevOps Advocate] Answered question 21st September 2020
Please login to be able to comment or post an answer.

My DevOps rank

DevOps Members get more insights on their profile page.

My user earnings

0 Dojo credits

Spend your credits in our swag shop.

0 Reputation points

Boost your reputation, climb the leaderboard.

Promo banner DataMiner DevOps Professiona Program
DataMiner Integration Studio (DIS)
Empower Katas
Privacy Policy • Terms & Conditions • Contact

© 2025 Skyline Communications. All rights reserved.

DOJO Q&A widget

Can't find what you need?

? Explore the Q&A DataMiner Docs