Skip to content
DataMiner DoJo

More results...

Generic selectors
Exact matches only
Search in title
Search in content
Post Type Selectors
Search in posts
Search in pages
Search in posts
Search in pages
Log in
Menu
  • Updates & Insights
  • Questions
  • Learning
    • E-learning Courses
    • Empower Replay: Limited Edition
    • Tutorials
    • Open Classroom Training
    • Certification
      • DataMiner Fundamentals
      • DataMiner Configurator
      • DataMiner Automation
      • Scripts & Connectors Developer: HTTP Basics
      • Scripts & Connectors Developer: SNMP Basics
      • Visual Overview – Level 1
      • Verify a certificate
    • Video Library
    • Books We Like
    • >> Go to DataMiner Docs
  • Expert Center
    • Solutions & Use Cases
      • Solutions
      • Use Case Library
    • Markets & Industries
      • Media production
      • Government & defense
      • Content distribution
      • Service providers
      • Partners
      • OSS/BSS
    • Agile
      • Agile Webspace
      • Everything Agile
        • The Agile Manifesto
        • Best Practices
        • Retro Recipes
      • Methodologies
        • The Scrum Framework
        • Kanban
        • Extreme Programming
      • Roles
        • The Product Owner
        • The Agile Coach
        • The Quality & UX Coach (QX)
    • DataMiner DevOps Professional Program
      • About the DevOps Program
      • DataMiner DevOps Support
  • Downloads
  • More
    • DataMiner Releases & Updates
    • Feature Suggestions
    • Climb the leaderboard!
    • Swag Shop
    • Contact
    • Global Feedback Survey
  • PARTNERS
    • All Partners
    • Technology Partners
    • Strategic Partner Program
    • Deal Registration
  • >> Go to dataminer.services

Buttons GQI

Solved654 views28th January 2025
0
Davor Joleski [DevOps Enabler]566 17th October 2024 0 Comments

Hi guys i wan’t to ask you about button how to make this queires for buttons yesterday last week etc and when i click to update the graph any idea how can i make that?

Marieke Goethals [SLC] [DevOps Catalyst] Selected answer as best 28th January 2025

3 Answers

  • Active
  • Voted
  • Newest
  • Oldest
4
Wout Mahieu [SLC] [DevOps Catalyst]7.66K Posted 18th October 2024 0 Comments

Hi Davor

I see that you are using a GQI query for your use case. You can configure this in a few steps:

  • Add a line & area chart component and time range component to the dashboard.
  • Create query that fetches the data of interest. This can use the built-in ‘Get trend data’ source or any ad hoc source. Make sure that the column that you want to use for the X-axis is a datetime column, otherwise the values will not be formatted as time.
  • Add 2 filter nodes to the query, 1 should filter the start time & 1 the end time. The values of the filters can be linked to the ‘to’ & ‘from’ feeds from the time range component.

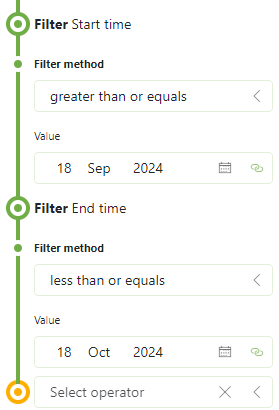
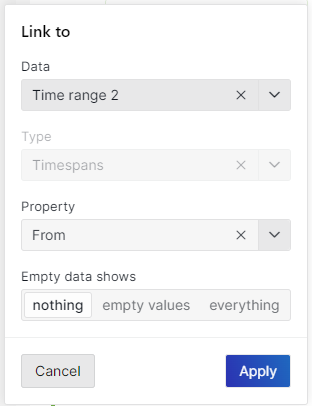
In the end, it will look like something this:

Marieke Goethals [SLC] [DevOps Catalyst] Selected answer as best 28th January 2025
7
Edith Lansens [SLC] [DevOps Advocate]719 Posted 17th October 2024 1 Comment

Hi Davor,

Could you try this?

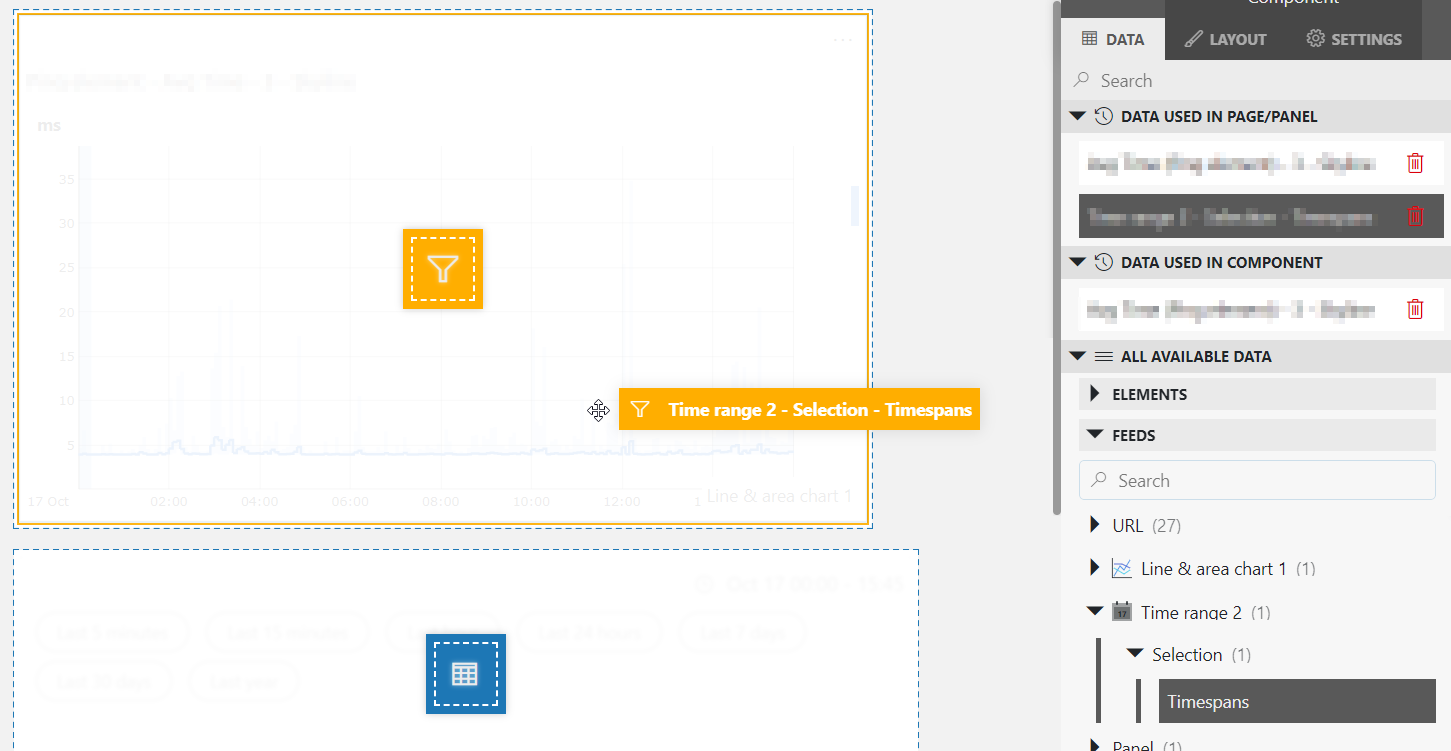
Select the line & area chart component and click the yellow filter icon (third icon from the left). Next, find “Time range” > “Selection” > “Timespans” in the Feeds section of the Data tab and drag that onto the line & area chart component. Now, whenever you click one of the quick pick buttons in the time range component, the timespan displayed in the line & area chart will automatically update as well.

Davor Joleski [DevOps Enabler] Posted new comment 18th October 2024
Davor Joleski [DevOps Enabler] commented 18th October 2024

HI edith thanks for you response but i cant drag that is unavailable ill show you the pic

0
Davor Joleski [DevOps Enabler]566 Posted 18th October 2024 2 Comments

as you can see here why is that

Wout Mahieu [SLC] [DevOps Catalyst] Posted new comment 18th October 2024
Edith Lansens [SLC] [DevOps Advocate] commented 18th October 2024

Hi Davor,

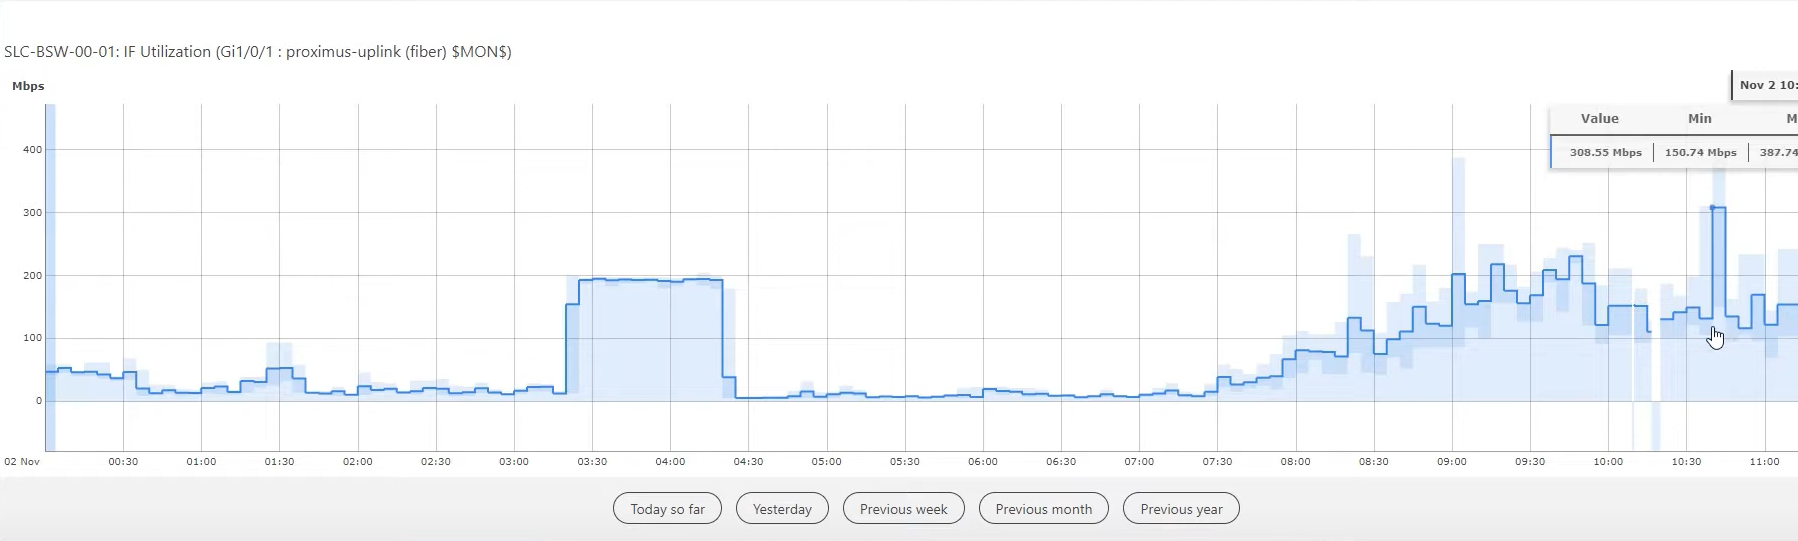
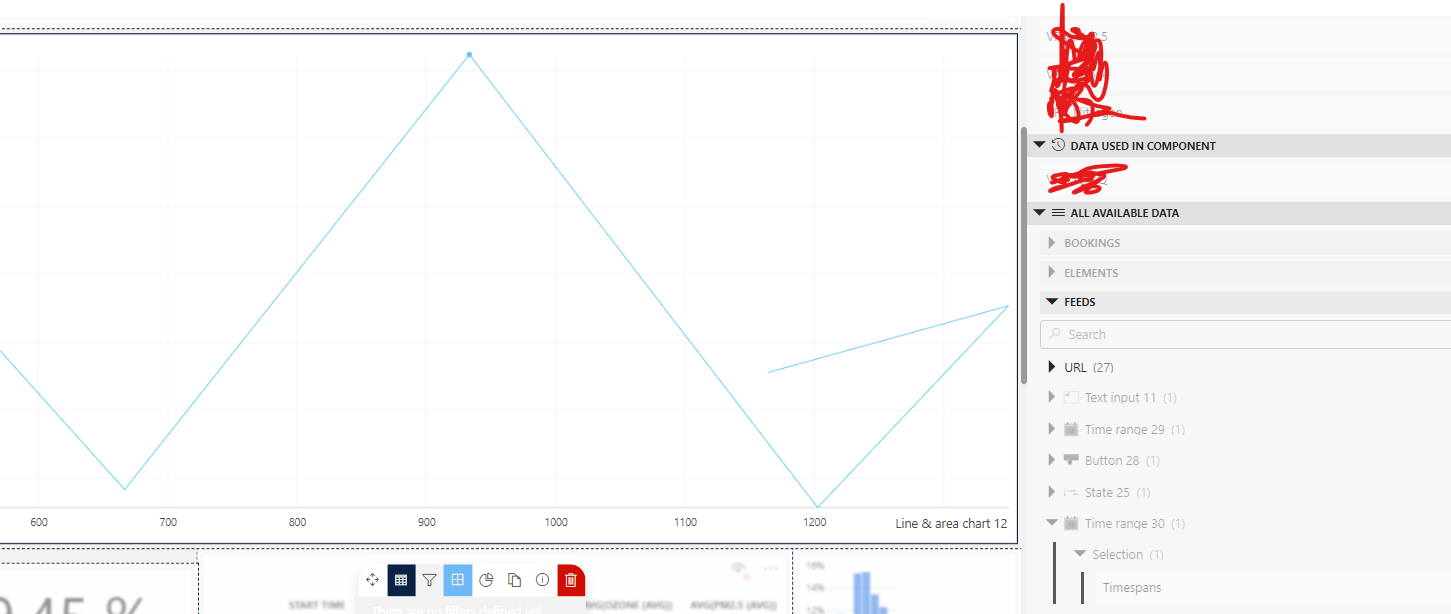
Thanks for the screenshot! It looks like the x-axis of your chart is displaying numbers like “600, 700, 800, 900,” which suggests the axis might not be configured to display time values. This could be why the timespans from the time range feed aren’t working.

To fix this, could you check if the x-axis is set to show time rather than numbers? Once the x-axis is configured to display time, the timespan feed should work as expected.

Let me know if that helps!

Wout Mahieu [SLC] [DevOps Catalyst] commented 18th October 2024

I can explain why this is happening: The data that is used on the line & area chart is a query in this setup, not parameter. In that case, the component will not accept a timespan as a filter. Instead, the filtering should happen on query level (see my answer). The values on the x-axis are not formatted as dates because the query column that is used on that axis is not of the datetime type.

Please login to be able to comment or post an answer.

My DevOps rank

DevOps Members get more insights on their profile page.

My user earnings

0 Dojo credits

Spend your credits in our swag shop.

0 Reputation points

Boost your reputation, climb the leaderboard.

Promo banner DataMiner DevOps Professiona Program
DataMiner Integration Studio (DIS)
Empower Katas
Privacy Policy • Terms & Conditions • Contact

© 2025 Skyline Communications. All rights reserved.

DOJO Q&A widget

Can't find what you need?

? Explore the Q&A DataMiner Docs