Skip to content
DataMiner DoJo

More results...

Generic selectors
Exact matches only
Search in title
Search in content
Post Type Selectors
Search in posts
Search in pages
Search in posts
Search in pages
Log in
Menu
  • Updates & Insights
  • Questions
  • Learning
    • E-learning Courses
    • Empower Replay: Limited Edition
    • Tutorials
    • Open Classroom Training
    • Certification
      • DataMiner Fundamentals
      • DataMiner Configurator
      • DataMiner Automation
      • Scripts & Connectors Developer: HTTP Basics
      • Scripts & Connectors Developer: SNMP Basics
      • Visual Overview – Level 1
      • Verify a certificate
    • Video Library
    • Books We Like
    • >> Go to DataMiner Docs
  • Expert Center
    • Solutions & Use Cases
      • Solutions
      • Use Case Library
    • Markets & Industries
      • Media production
      • Government & defense
      • Content distribution
      • Service providers
      • Partners
      • OSS/BSS
    • Agile
      • Agile Webspace
      • Everything Agile
        • The Agile Manifesto
        • Best Practices
        • Retro Recipes
      • Methodologies
        • The Scrum Framework
        • Kanban
        • Extreme Programming
      • Roles
        • The Product Owner
        • The Agile Coach
        • The Quality & UX Coach (QX)
    • DataMiner DevOps Professional Program
      • About the DevOps Program
      • DataMiner DevOps Support
  • Downloads
  • More
    • DataMiner Releases & Updates
    • Feature Suggestions
    • Climb the leaderboard!
    • Swag Shop
    • Contact
    • Global Feedback Survey
  • PARTNERS
    • All Partners
    • Technology Partners
    • Strategic Partner Program
    • Deal Registration
  • >> Go to dataminer.services

Automatic shape drawing

Solved1.75K views17th July 2023Dashboards dynamic visio design Visio
3
Elvio Mendes398 3rd December 2021 0 Comments

We are investigating the possibilities for automatically generating shapes on a visio world map, to display the service status of that region based on alarm bubbling up.

However, rather than designing the regions on the map, this needs to be dynamically populated, and the shapes format also dynamically designed based on polygons defined in .kml files available in the dataminer documents folder.

Would there be a way of dataminer supporting this use case?

Marieke Goethals [SLC] [DevOps Catalyst] Selected answer as best 17th July 2023

2 Answers

  • Active
  • Voted
  • Newest
  • Oldest
5
Alberto De Luca [DevOps Enabler]4.60K Posted 3rd December 2021 2 Comments

Elvio, it’s an interesting use-case.
As Ben suggests, there can be many scenarios to explore:

-indeed when using .kml maybe you’re also entitled to the usage of Google Maps in your system;

–positioning shapes dynamically is supported;

-for the overall visio look, if a VISIO map is required, you could perhaps rely on certain shape labels to make the objects dynamically added on the view only, in case of alarms;

– changing the format of the shape on the go would require some research, if nothing else to establish the general look and feel of the UI.
I haven’t played much with this but I understand kml is engineered to look great on maps for Earth-Browsers – if using a visio map, the result can become quite different

HTH,
A.

Marieke Goethals [SLC] [DevOps Catalyst] Selected answer as best 17th July 2023
Ben Vandenberghe [SLC] [DevOps Enabler] commented 4th December 2021

Thanks for your input Alberto – And indeed .klm can be a lot, but I (maybe wrongly) assumed that the .klm’s in this case were satellite footprints (showing a flat area where satellite beams go on the surface of the globe), and if that’s the case, those could be converted in shapes that can be drawn with the Path Markup capability of Visual Overview.

Alberto De Luca commented 7th December 2021

I think the assumption is fair and legitimate in the context of satellite beams (;

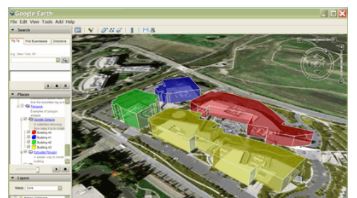
I took an example from the generic KML documentation on Google’s side:
https://developers.google.com/kml/documentation/kml_tut

I understand that Google’s documentation was the starting point for what was standardised later on in OGC:
https://www.ogc.org/standards/kml/

4
Ben Vandenberghe [SLC] [DevOps Enabler]9.09K Posted 3rd December 2021 1 Comment

Elvio – just in case, but there is also an option to use a Google Maps or other map solution as your canvas and dynamically load managed objects on that along with your .kml files.  Not sure if you can map services, would have to check that.  But wanted to bring this up to see if this would be an option?  DataMiner Help

If you want to work with a Visio design in Visual Overview, I’m thinking of the Path Markup feature.  But that would require you to take the .klm data and convert it into coordinates that can be used to trace a path on Visual Overview dynamically (which could be done in a driver with some code, i.e. read the .klm data and generate the trace coordinates, which can then be used to drive the Visual Overview UI).  DataMiner Help

Elvio Mendes Posted new comment 3rd December 2021
Elvio Mendes commented 3rd December 2021

Thanks Ben.
I believe that, if we could link the managed objects (kml-defined areas) to a view, element, or service, and color code based on highest severity alarm, all on top of the google maps, that could suffice this use case and show the status of the service delivered to a region.

Please login to be able to comment or post an answer.

My DevOps rank

DevOps Members get more insights on their profile page.

My user earnings

0 Dojo credits

Spend your credits in our swag shop.

0 Reputation points

Boost your reputation, climb the leaderboard.

Promo banner DataMiner DevOps Professiona Program
DataMiner Integration Studio (DIS)
Empower Katas
Privacy Policy • Terms & Conditions • Contact

© 2025 Skyline Communications. All rights reserved.

DOJO Q&A widget

Can't find what you need?

? Explore the Q&A DataMiner Docs