Skip to content
DataMiner DoJo

More results...

Generic selectors
Exact matches only
Search in title
Search in content
Post Type Selectors
Search in posts
Search in pages
Search in posts
Search in pages
Log in
Menu
  • Updates & Insights
  • Questions
  • Learning
    • E-learning Courses
    • Empower Replay: Limited Edition
    • Tutorials
    • Open Classroom Training
    • Certification
      • DataMiner Fundamentals
      • DataMiner Configurator
      • DataMiner Automation
      • Scripts & Connectors Developer: HTTP Basics
      • Scripts & Connectors Developer: SNMP Basics
      • Visual Overview – Level 1
      • Verify a certificate
    • Video Library
    • Books We Like
    • >> Go to DataMiner Docs
  • Expert Center
    • Solutions & Use Cases
      • Solutions
      • Use Case Library
    • Markets & Industries
      • Media production
      • Government & defense
      • Content distribution
      • Service providers
      • Partners
      • OSS/BSS
    • Agile
      • Agile Webspace
      • Everything Agile
        • The Agile Manifesto
        • Best Practices
        • Retro Recipes
      • Methodologies
        • The Scrum Framework
        • Kanban
        • Extreme Programming
      • Roles
        • The Product Owner
        • The Agile Coach
        • The Quality & UX Coach (QX)
    • DataMiner DevOps Professional Program
      • About the DevOps Program
      • DataMiner DevOps Support
  • Downloads
  • More
    • DataMiner Releases & Updates
    • Feature Suggestions
    • Climb the leaderboard!
    • Swag Shop
    • Contact
      • General Inquiries
    • Global Feedback Survey
  • PARTNERS
    • All Partners
    • Technology Partners
    • Strategic Partner Program
    • Deal Registration
  • >> Go to dataminer.services

Aggregation Tree or Aggregation Table in HTML5 Dashboards

Solved1.12K views30th July 2021Aggregation rule Dashboard
1
Randy Ulvenes [SLC] [DevOps Advocate]999 28th July 2021 2 Comments

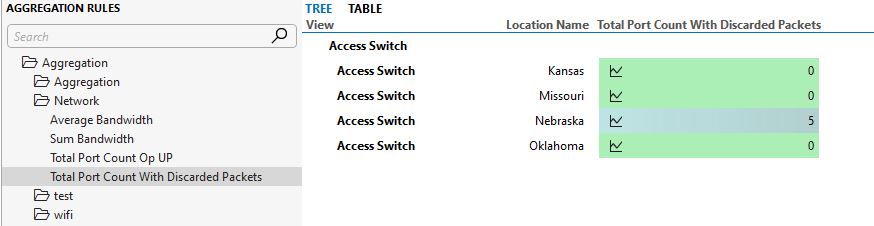
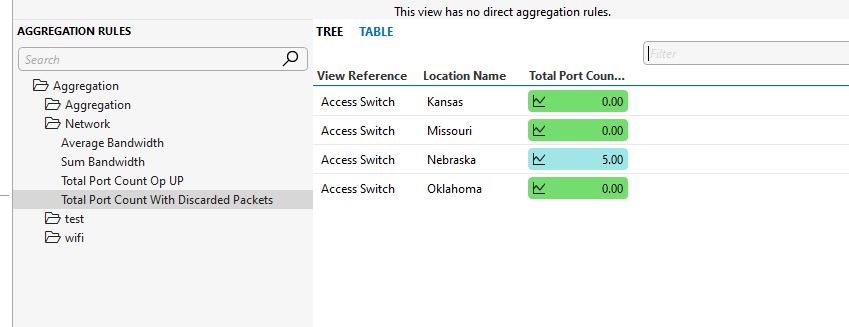
The HTML5 Dashboard can display single aggregation data points.  Can an Aggregation Rule Tree or Table be displayed in the HTML5 Dashboard.   Such as the tree and table show in the images.

Randy Ulvenes [SLC] [DevOps Advocate] Selected answer as best 30th July 2021
Rene De Posada [SLC] [DevOps Advocate] commented 28th July 2021

Randy – It might also be that you are able to use GQI to come up with dynamic aggregations within the Dashboards client itself.

Randy Ulvenes [SLC] [DevOps Advocate] commented 28th July 2021

Hi Rene – That is true.

That was one option we have explored. All the data needs to be displayed on the same page. The issue is we would need to create about 20 separate queries. All the data is already in a aggregation rule table.

As Wim mentioned, one option is to create and aggregation component in a Cube Dashboard. I can put this dashboard into a visio/view and then add it to the new dashboard. I was looking a direct method from the Dashboard App.

1 Answer

  • Active
  • Voted
  • Newest
  • Oldest
2
Wim Bruynooghe [SLC] [DevOps Advocate]6.59K Posted 28th July 2021 3 Comments

This is not possible yet in the new Dashboards application. Feel free to create a new task on Collaboration to get this added.

It is possible to do this in the legacy Dashboards module via the Aggregation component.

Wim Bruynooghe [SLC] [DevOps Advocate] Posted new comment 18th August 2021
Ben Vandenberghe [SLC] [DevOps Enabler] commented 28th July 2021

Hi Wim – just a thought, not entirely sure, but isn’t the aggregation data stored in a hidden system element, and in that case would it be conceivable that the data can be displayed in a new dashboard if one would know the reference ID of that element? Long shot probably, but I wanted to make sure that this is not maybe achievable via this less conventional way.

Pieter Van Compernolle [SLC] [DevOps Enabler] commented 18th August 2021

You can get the data via a GQI query (get parameter table by id node) if you get to know the element ID indeed (not via the ‘parameter’ data source in dashboards because the aggregation element is hidden in the element selection boxes).
The result will be a rough result table with view ID’s (which you can resolve via joining the view info)

PS: You can get to know the Aggregation element info by doing a Info/AggregatorElementInfo request via slnetclienttest tool.

Wim Bruynooghe [SLC] [DevOps Advocate] commented 18th August 2021

If you know the ID of the aggregation element (can also be found in the rule configuration xml), then there are indeed some hacky ways to visualize the data (using GQI like Pieter’s comment, or by manually editing a dashboard json file). But this raw table data contains raw rule IDs, view IDs, PKs, etc. Via a table component, the data won’t be nicely shown in a collapsible tree. Via a GQI query, it won’t show units, trend icons, nor the alarm severity.

Please login to be able to comment or post an answer.

My DevOps rank

DevOps Members get more insights on their profile page.

My user earnings

0 Dojo credits

Spend your credits in our swag shop.

0 Reputation points

Boost your reputation, climb the leaderboard.

Promo banner DataMiner DevOps Professiona Program
DataMiner Integration Studio (DIS)
Empower Katas
Privacy Policy • Terms & Conditions • Contact

© 2025 Skyline Communications. All rights reserved.

DOJO Q&A widget

Can't find what you need?

? Explore the Q&A DataMiner Docs