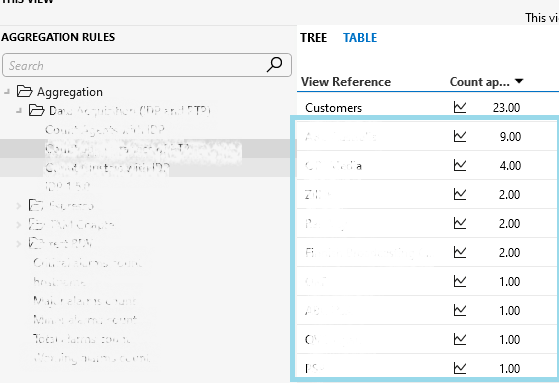
I configured an aggregation rule and would like to visualize the table results in a dashboard. In the below, there's a result for the view Customers, but I'm looking for an easy way to visualize the numbers for each view beneath it.

I'm aware it's possible to visualize the result for a view specifically, but then I need to drag the parameter for each view on the dashboard separately. The sub views are dynamic and - tbh - I'm not interested in the ones that are zero.
Hi Jan-Klaas,
It is possible to retrieve the results from the aggregation rules using GQI queries, but it is not straightforward. Before to build the aggregation rule, you will need to know the element ID of the aggregator element. You could get the element ID from the log file C:\Skyline DataMiner\Logging\SLElementInProtocol.txt. The connector name is Skyline Generic Aggregator. The element ID will be next to the timestamp. For example:
2024/03/15 14:39:34|123/100|Skyline Generic Aggregator DMA1002059|12872|Skyline Generic Aggregator|Production|1.0.0.6|
In this example the element ID is 100
Once you get the element ID, you can proceed with building the GQI query:
- Get parameter table by ID
- DMA ID: The DMA ID of the Skyline Generic Aggregator element
- Element ID: The element ID of the Skyline Generic Aggregator element
- Table ID: Data
- Select
- Result View Reference
- Result Value
- Join (Inner)
- Get View
- Select
- View ID
- View Name
- On 'Result View Reference' equals 'View ID'
From the result, you will only need two columns: Name, Result Value
Below an example of this query:

I didn't test this query extensively, so I will recommend testing it before to use it on production environments. Another option (most recommended) is to use the built-in aggregation operation available in GQI queries.
Hope it helps.