Do you estimate the size of your individual work items? Good! Or is it?
Experience teaches us that estimations are very, very often wrong, and that’s okay. However, if there are ways to estimate just how wrong we are, shouldn’t we further embrace that instead of deciding on one number and hoping it’s kind of okay? What if we could tell just how wrong we likely are? Introducing the Monte Carlo Simulation.
Blog post overview
1️⃣ Why are estimations wrong?
2️⃣ What is the Monte Carlo Simulation and how does it work?
Why are estimations wrong?
First of all, let me dive a bit deeper into why your estimations are so often wrong.
Off the bat, estimating complex work with no basis is very hard. You are much more likely to be wrong than to be right. In fact, you are often so wrong that the amount of items you complete is more constant than the number of story points. Don’t believe me? Why don’t you check your team’s historical data for both and see for yourself? If you find that your estimates are more correct: Congratulations, you are the exception. If this is not the case, do read on. In fact, why don’t you read on either way? You might be able to avoid some waste.
The problem with averages
Let’s say you track the average amount of work you get done every 2 weeks (the most common length of a sprint). Good job, you haven taken a first, important step: gathering data. You are now well on your way to making better estimations and eventually completing every sprint. Right? Well, you could be, but first: How are you planning your next sprint? Do you take the average amount of work you get done and put that in the planner? If so, you now have a 50% chance that you will achieve your goal. That doesn’t sound too good, does it? However, if I told you that you are more likely to finish MORE than your chosen amount, that might soften the blow a bit. Even so, you want to make sure you achieve the goals you set, right?
First, we have to be realistic. We can NEVER guarantee we will reach our goal. There is no such thing as being 100% sure, especially in a complex environment such as ours. But what we can do is factor in the risk. If we predict we have an 85% chance of making our goal and there’s close to 85% chance we will finish more than the goal, that sounds a lot better already, doesn’t it?
So how do we do this? Here’s where the Monte Carlo Simulation comes into play.
What is the Monte Carlo Simulation and how does it work?
Part of what a Monte Carlo Simulation (MCS for short) is all about is encapsulated in its name: it’s a simulation. It takes in historical data and makes simulations with the goal of making an assessment of the future. No matter what, the future is uncertain. But with the right amount of simulations, we can estimate the chances of particular outcomes.
Based on this, a conversation can happen about how we want to scope a project or something similar. How certain do we want to be that we are finished by (very important: not ON but BY) a certain date? Based on the simulations, we can say: “There’s an 85% chance of us being finished by this date, but there’s also a considerable probability that we will be finished earlier.” Depending on the way you want to scope the project, you can choose an Agile Scope (where you finish the time budget and see what you have) or an Agile Budget (where more budget can be allocated as long as the goal of the project is not reached). The Monte Carlo Simulation will allow you to accommodate both with this kind of assessment.
Let’s say you and your entire team can focus on the same user story and that said user story consists of 20 individual items of work. The stakeholder wants to know by when you estimate the work will be done. Let’s get to it.
Input
Are you already tracking your team’s throughput somehow? Great! You’re not? No problem. Earlier I talked about the risks of averaging, so we’re going to do that as little as possible. That means you don’t need a year of averaged data to start. Rather, we want a decent data set from the more recent past. No total or average throughput of the last year, but the actual number of tasks finished on each day in the recent past. Let’s take a day or 30. This means that you will have 30 days’ worth of throughput numbers. Yes, some of these days (e.g. weekend days) will remain at 0 and that’s perfectly okay. That’s merely realistic. This part is the most important one: You want to choose realistic and correct data. If you aim to make a simulation for a month in which there are a few holidays or you’re taking some days off, you want your input to be similar. There’s no use in taking the throughput of the month of December, which includes the Christmas holidays, as input for the month of March.
The second part of our input is the number of items we want to finish. As stated above, we will aim for 20 individual items for the sake of this example.
The final part of the input is the number of simulations we will do. We will get to that in a second.
One simulated run
We now have our input, which means it’s time to run our first simulation. We start by taking a random throughput entry of one of our last 30 days. In other words, we select a random day and take its corresponding throughput number. Let’s say it’s 1. We keep selecting days and adding the throughput of those days to our total (even if a day’s throughput is 0). The moment we have a throughput of 20 or more, we stop. At this point, we count the number of days we included. This number is the result of our first simulation. In our example, let’s say it’s 75.
Roll the dice
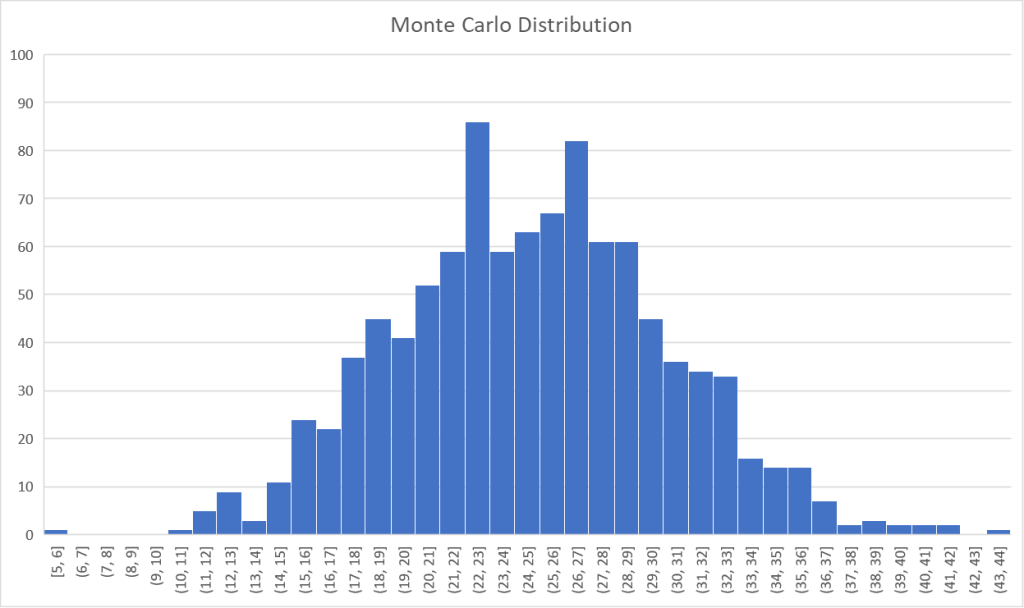
As you saw in our one simulated run, we took completely randomized days. Just like it makes no sense to estimate using averages, it also makes no sense leaving it at only one resulting run. This is merely one possible outcome. We want to run this a couple thousand times to get a nice distribution of results. The result will look something like this:

Reading the result
Let’s take the 50th percentile of the results. In the case of our example above, that leaves us with a result of 89 days. If you now go to your stakeholder and tell them you will be finished 89 days from now, I suggest you reread the section on why estimations are so often wrong. To put it boldly, if you give the impression that it will take you exactly 89 days, there’s a 99.6% chance you are wrong. There is a possibility of about 50% that you will finish sooner, but also one of almost 50% that predicts you will finish later.
So what should you tell the stakeholder? Well, that’s where our scopes come in. Calculate some percentiles on your data and start collaborating. Some popular percentiles are the 85th (in our case: 112 days) and 95th percentile (128 days).
In the case of an Agile Scope, the message should be: “If you set the deadline at x days from now, there’s a y% chance that we will finish what’s currently on the table OR MORE.” For our example this would translate to: “If you set the deadline 112 days from now, there’s an 85% chance that we will finish what’s currently on the table OR MORE”. And as stated above, the chances of finishing MORE are significantly higher (close to 85%) than finishing less (close to 15%).
If the project has a strict timeline, but less strict scope, we’re able to tell what the chances are of being finished by their deadline OR sooner. However, in most cases like this, we will slightly modify the simulation and simulate the number of items we can complete in x days. More on that later.
For either scope, there’s a question of certainty that should be answered by the stakeholder.
Various ways to apply Monte Carlo Simulations
Project scope
As the example above showed, the Monte Carlo Simulation can be used to estimate when we should set a deadline for a project. Based on how many work items a certain project comprises, we can give an estimation of how long it will take and when we thus want to stop working on it. Depending on the kind of project, you can choose to keep working until the deadline, evaluating the outcome regularly and making sure you are constantly working on the right thing. In the end, you should be left with something that might not completely match the ideas you had at the start, but that is at least of equal value (that’s why we work agile).
Different types of project scope
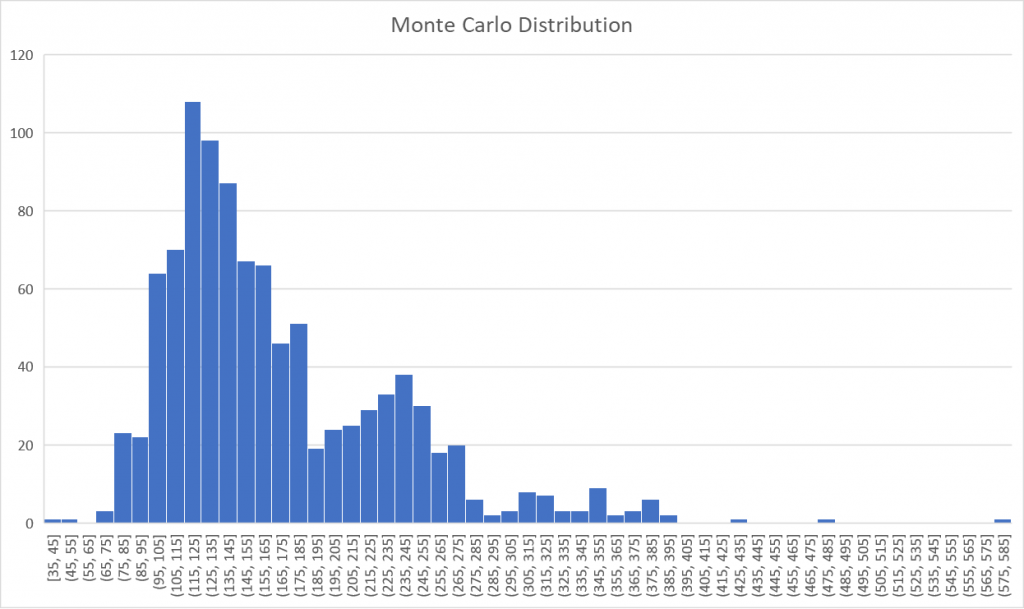
In case you know you have a certain deadline, but have no clear idea of the desired outcome, you can also choose to estimate how many work items can be done by the end of the project. For this, the simulation uses the same data, but in a slightly different way.
Instead of simulating the number of days it will take for a given amount of tasks to be done, we will now simulate a given amount of days and see what our throughput can be.
List<int> allSimulationThroughputSums = new List<int>();

Random r = new Random();
for (int j = 0; j < simulationCount; j++) // Outer loop is the amount of simulations we will run
{
    int totalThroughput = 0;
    for (int i = 0; i < daysToPredict; i++) // Loop the number of days until the project deadline
    {
        var dayToPick = DateTime.Now.AddDays(-r.Next(27)); // A random day out of our historical data is selected
        var throughputOnDay = completedTimeStamps.Count(x => x.Day == dayToPick.Day && x.Month == dayToPick.Month && x.Year == dayToPick.Year);
        totalThroughput += throughputOnDay; // The throughput of that day is added to the total throughput
    }
    allSimulationThroughputSums.Add(totalThroughput); The total throughput of one simulation is added as one possible result
}
The result of something similar to the code above can subsequently be put into a distribution graph as well.
Similar to how we would read the result for a project deadline, we can use this to predict what items will likely be finished by the deadline and which run a higher risk of not getting done. For instance, there’s an 85% chance that we will finish the top 19 items OR MORE. We’re also 95% sure we will at the very least finish 16 of them. This can help prioritize the backlog, but it can also be a trigger to discuss extending the project deadline. If the stakeholder considers the top 25 items an absolute must, it should be made clear there’s a 50% chance that we will not make it. Quite the flip of a coin…
Active time budget
Estimating time needed
Deadlines are important, but for invoicing, the time spent developing something is also quite important. Here, the MCS can help as well. Rather than basing our estimations on cycle times (the total time elapsed between an item being started and finished), we should make estimations based on the time actively spent on the items. As always, choose a time budget that you feel comfortable with and contact the stakeholders when a situation changes (e.g. an item should be added to the scope, or unexpected events have caused the current prediction to change).
Internally, teams are also sometimes asked how much time they will spend actively developing something. Although I would discourage making this estimation in the first place if it’s not strictly necessary, the exact same MCS can be used to obtain your answer.
Estimating the number of items
Again, the abovementioned simulation can be run the other way around as well. If a stakeholder has a certain time budget to spend, we can simulate how many items can be tackled within that budget.
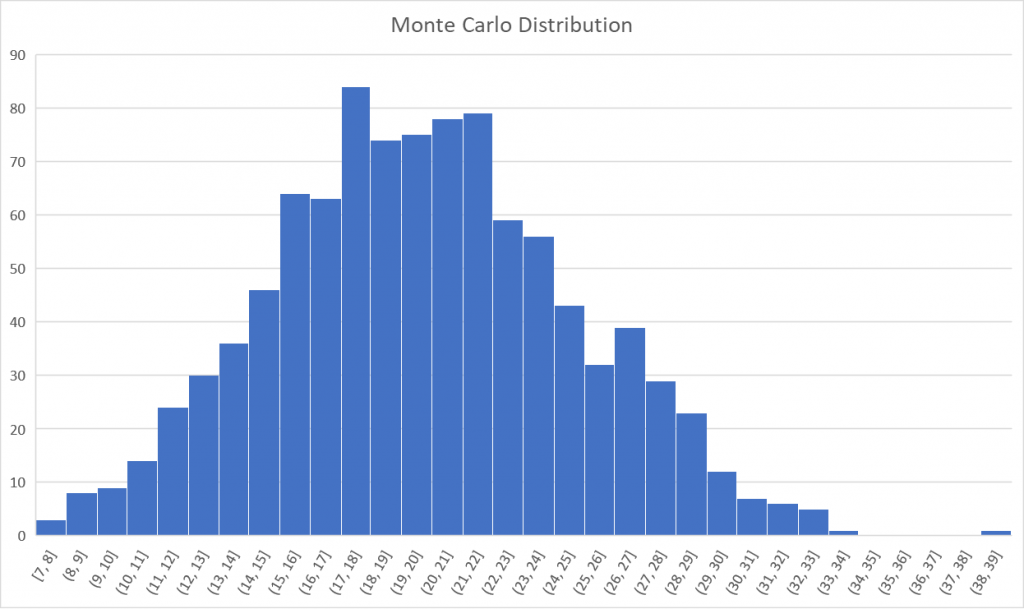
With this result, you can again sit down with the stakeholder to discuss whether the budget allocated is enough. There’s an 85% chance that the team will finish the top 15 items of the backlog OR MORE within the budget. If the top 20 items are a MUST for the stakeholder, it should be made clear that it’s a coin flip whether or not that will be achieved within the given budget. This can prompt conversation about either increasing the budget or limiting the number of user stories that are required.
Review meetings
So far, we’ve mostly talked about making an initial simulation, often for agile contracting negotiations. But as everyone in our complex business knows, things change. The major upside of these simulations is that they can be run again at any time, factoring in the changes in conditions.
Sprint reviews or other regular increment inspection meetings are a perfect opportunity for this. When the increment has been discussed, the stakeholder and team can collaborate on what changes have occurred or should be made to the backlog. Maybe some work took longer than expected, maybe priorities shift, etc. You can run the Monte Carlo Simulation(s) again to reassess. You can even run multiple simulations for different potential situations, deciding on which track to follow depending on the results.
The further down the line you are, the smaller the spread will be in your results. This entails less risk and more accurate predictions.
Retrospectives
The Monte Carlo Simulation can also be used to evaluate your team’s performance at the end of a sprint or another interval of your choice. Run the MCS as shown above for the number of items you finished in that period.
- Did we finish as much or more than expected? What positive change occurred that acted as a catalyzer?
- What happened that caused us to finish fewer items than expected? What should we change in the future?
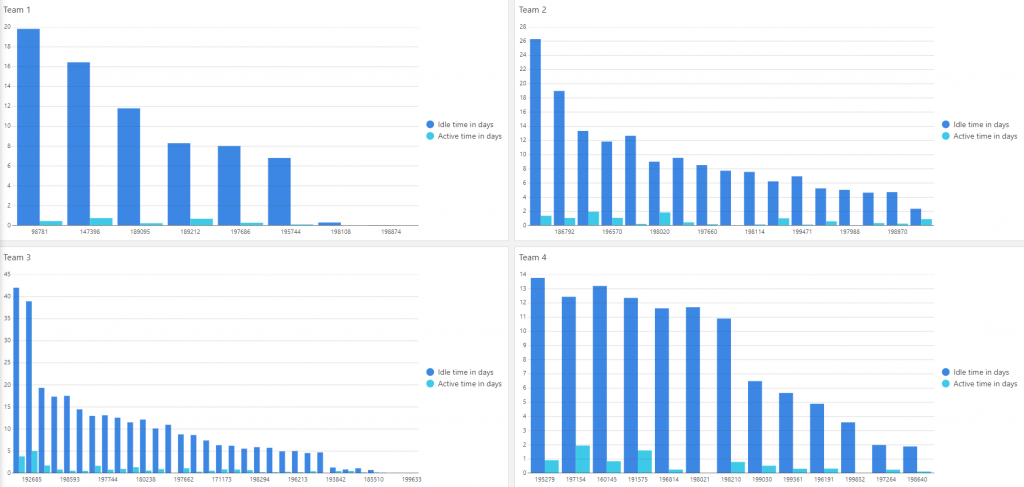
- Did we actively spend less time per item but have we still finished fewer of them? Maybe something is blocking our flow? Are Items idle for too long?
Planning
If it wasn’t clear yet that SCRUM and flow metrics like the MCS go hand in hand, it should be by now. The simulations can be used for all aspects of planning as well. During the planning phase, after determining your goal, decide what items to include and run a simulation to see how likely it is that you’ll complete those. Adjust your sprint backlog accordingly.
Not working SCRUM? Maybe the Monte Carlo Simulation can serve as a trigger for refinement meetings. If you run the simulation at regular intervals, you should be able to see how likely it is that you will soon run out of refined items (at the top of your backlog) to pull into your workflow. Based on this, you can decide when and how often to refine the top of your backlog.
Broadening the horizon
While this article heavily focuses on individual, often small, items of work, the applications of the Monte Carlo Simulation are plentiful.
The exact same simulations can be applied to high-level estimations as well as low-level ones. The only thing you need to do is make sure that your input data is of the same type as what you’re simulating for. Simulate for major project deliveries based on the number of deliverables, simulate for the number of new products to create, simulate for the number of connectors to be written, simulate for the number of parameters to be monitored in a system, etc. The options are endless, as long as you have the right input data.
Every situation is different, but every situation is also in a way similar to something you’ve done before. The trick is to recognize these similarities and make the correct risk-based assessment, rather than purely resorting to an exact estimation in the form of a set number.
Things to keep in mind
Part of the puzzle
As with almost every metric, methodology, and even framework, using Monte Carlo Simulations is not the solution to all of your problems. MCS and flow metrics in general are extremely useful and important, but you’ll need more than that to optimize your flow. Not only will you need a clear definition of workflow BEFORE you can start using these simulations, but you will also need a spirit of optimization. This means you want to actively look for improvements and new ways to optimize your way of working.
So, when we have all that, do we have everything we need? No, of course not. One of the biggest things flow metrics lack is being able to measure value. Measuring and simulating throughput is great, but if you’re not working on the right thing, what good are predictability and output?
Right-sizing
I already briefly mentioned right-sizing when going over some examples of distribution graphs earlier. In this section, I discuss this topic in more detail. The biggest criticism of the Monte Carlo Simulation, and no-estimations in general, is that we can’t make accurate predictions if items are of different sizes. However, there are a couple of things at play here that can hopefully convince the skeptics.
Flow over active development
First of all, how long you will actively work on an item is not that relevant. More important is how well the item flows. The cycle time of the item is impacted much, much less by the amount of work to be done. Even when purely estimating the amount of time you actively work on something, your time spent context switching takes a huge part in that as well. Higher cycle times often result in more active time, purely because there’s more context switching happening.
“Yes, but Toon, you can see there’s still a difference between the larger tasks and the smaller ones, can’t you?” Of course I can, and that difference will always exist. It will even exist when you offset the difference with a factor like estimations. In fact, in our own team, data has indicated that the difference was even bigger if that was the case.
Minimal effort for maximum result
Do we then not need to do anything to mitigate this? Well, we will do as little as possible. The trick is to avoid the outliers you see in some of the graphs above. A good definition of workflow and workflow items will help you with that. If you have the data, take the 85th percentile of your cycle times and try to resize all of your items to be smaller than that threshold. If you don’t, follow your gut feeling and start gathering the data from now onward. We will call this 85th percentile our Service Level Expectancy. When you pick up an item, ask yourselves the question: “Can we finish it within the Service Level Expectancy?”. If the answer is yes, great! You can immediately move on. No need for further estimations or stumbling over details. If the answer is no, try to split up the item into smaller parts. Explaining the plethora of techniques to do this will be something for another time.
Multiple simulations
The tricks above will minimize the spread and amount of outliers in our cycle times with minimal effort. And finally, the many, many simulations a Monte Carlo Simulation runs will take care of the rest. We work in an uncertain and complex environment, which is exactly why we’re not going to bother making our estimations a specific number, but rather a window of probabilities.
If you are seeing too much of a spread in the result of your MCS, it’s potentially because you’re not splitting up your items enough. However, the opposite, doing TOO MUCH in terms of estimating and breaking up items, is going to be a more likely cause, though. Try to minimize the waste while keeping the benefits.
More info on flow metrics
Are you interested in more flow metrics and how to use them? Want to learn some techniques to help right-size items? Want to see how Kanban ties into all of this? Let me know in the comments and you might read about it in a future blog post!
You might also like

BLOG
Peer feedback is an essential component in evolving as a person, a team, and an organization. Additionally, it’s also an undeniably important and great evaluation tool.

BLOG
Best practices to order your product backlog
Take a look at some common practices to order your product backlog. Ranging from manual ordering to formulas, to aspects worthwhile to consider.
We (software people) mostly agree with the reality that estimates and forecasts will, almost always, be wrong. Going with this assumption, I’d like to be wrong but early! Awesome post!
Going from ‘estimating backlog items’ to ‘splitting them up until they are small enough to fit in your service level expectancy’ is so much easier… I moved from ‘team skeptic’ to ‘team MCS’ 🙂
Thx Toon for sharing this.