Hi All,
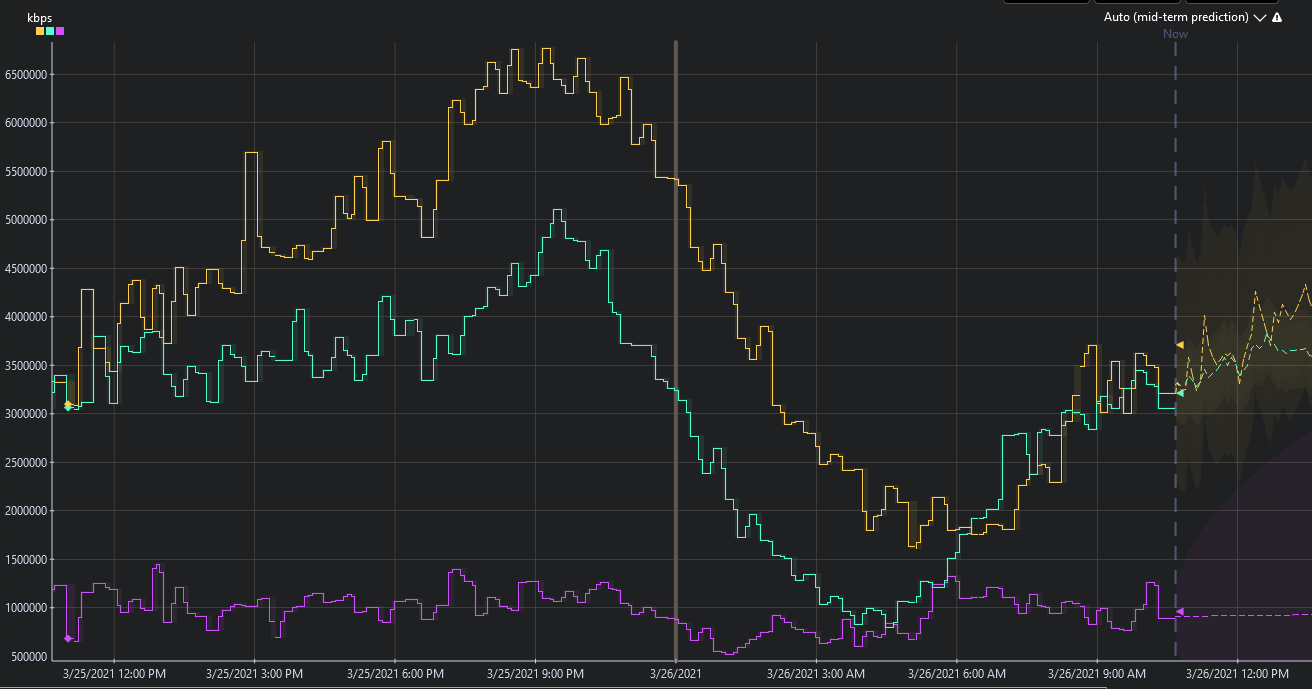
Is there away to show the total bandwidth Utilization of 3 interfaces as one in a trend graph or Dashboard? Instead of it showing 3 lines it will only show one. 
You are probably looking for a stacked trend line. See also Is it possible to have a dashboard to show multiple interfaces bandwidth aggregated? – DataMiner Dojo
We currently have a task on top of our backlog to add stacked trend lines in DataMiner Dashboards (scheduled for feature release 10.1.6, expected end of May)
Hi Jonathan,
I was planning to mention about aggregation, however (as far as I know) currently it is not possible to aggregate specific rows from a table. The aggregation rule will make a calculation based on all the rows from a table.
Thanks Miguel it makes sense indeed – how would we go about this in that case ? I was thinking about grouping the parameters into an enhanced service or custom KPI/KQI, but that may be an overkill ?
Hi Pieter, I think Leynard is also after a single trend that would contain the sum of all 3 values, and maybe Aggregation would help ?