Hi everything,
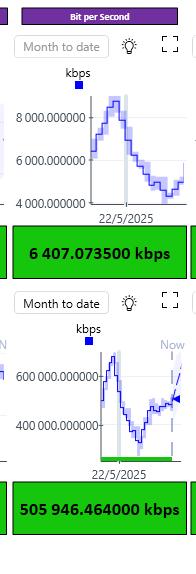
I am doing a Visio; however, the data grabbed contains alot of useless decimal point as shown as below:

Hence, how can I remove this decimal points OR just make it to 2 decimal places?
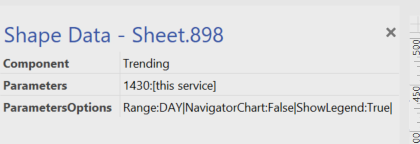
As shown below is my syntax for the graph:

As shown below is the syntax for that greenbox

Thank you very much for your assistance and have a nice day!
As this question has now been inactive for a very long time, I will close it. If you still want more information about this, could you post a new question?
Hi Fawzan,
Please could you let us know the connector that you are using for the trend chart? It could be the case that you are using dynamic units. If this is the case, as far as I know it is not possible to reduce the decimal numbers.
Hope it helps.
Hi Fawzan,
You can try adding a shape data filed 'Options', then 'Decimals=2' for the value.

This should display the returned value with 2 decimal places.
Thanks,
Steve
Nice!
Thank you Steve! It works on that Green Box.
However for the chart above, it still remains the same.. there is still a lot of decimal places on y axis.
* * *
This is my syntax for that chart:
——————————————————————————————————————————
Component: Trending
Parameters: 1431:[this service]
ParametersOptions: Range:DAY|NavigatorChart:False|ShowLegend:True|
Options: Decimals=2
——————————————————————————————————————————
I also tried to do like this:
——————————————————————————————————————————
Component: Trending
Parameters: 1431:[this service]
ParametersOptions: Range:DAY|NavigatorChart:False|ShowLegend:True|Decimals=2
——————————————————————————————————————————
and this:
——————————————————————————————————————————
Component: Trending
Parameters: 1431:[this service]
ParametersOptions: Range:DAY|NavigatorChart:False|ShowLegend:True|Decimals:2
——————————————————————————————————————————
However, the chart still has a lot of decimals.. haha.. might be there a specific syntax for the chart?
Thank you very much for your assistance and have a nice day!
I see that this question has been inactive for some time. Do you still need help with this? If not, could you select the answer (using the ✓ icon) to indicate that no further follow-up is needed?