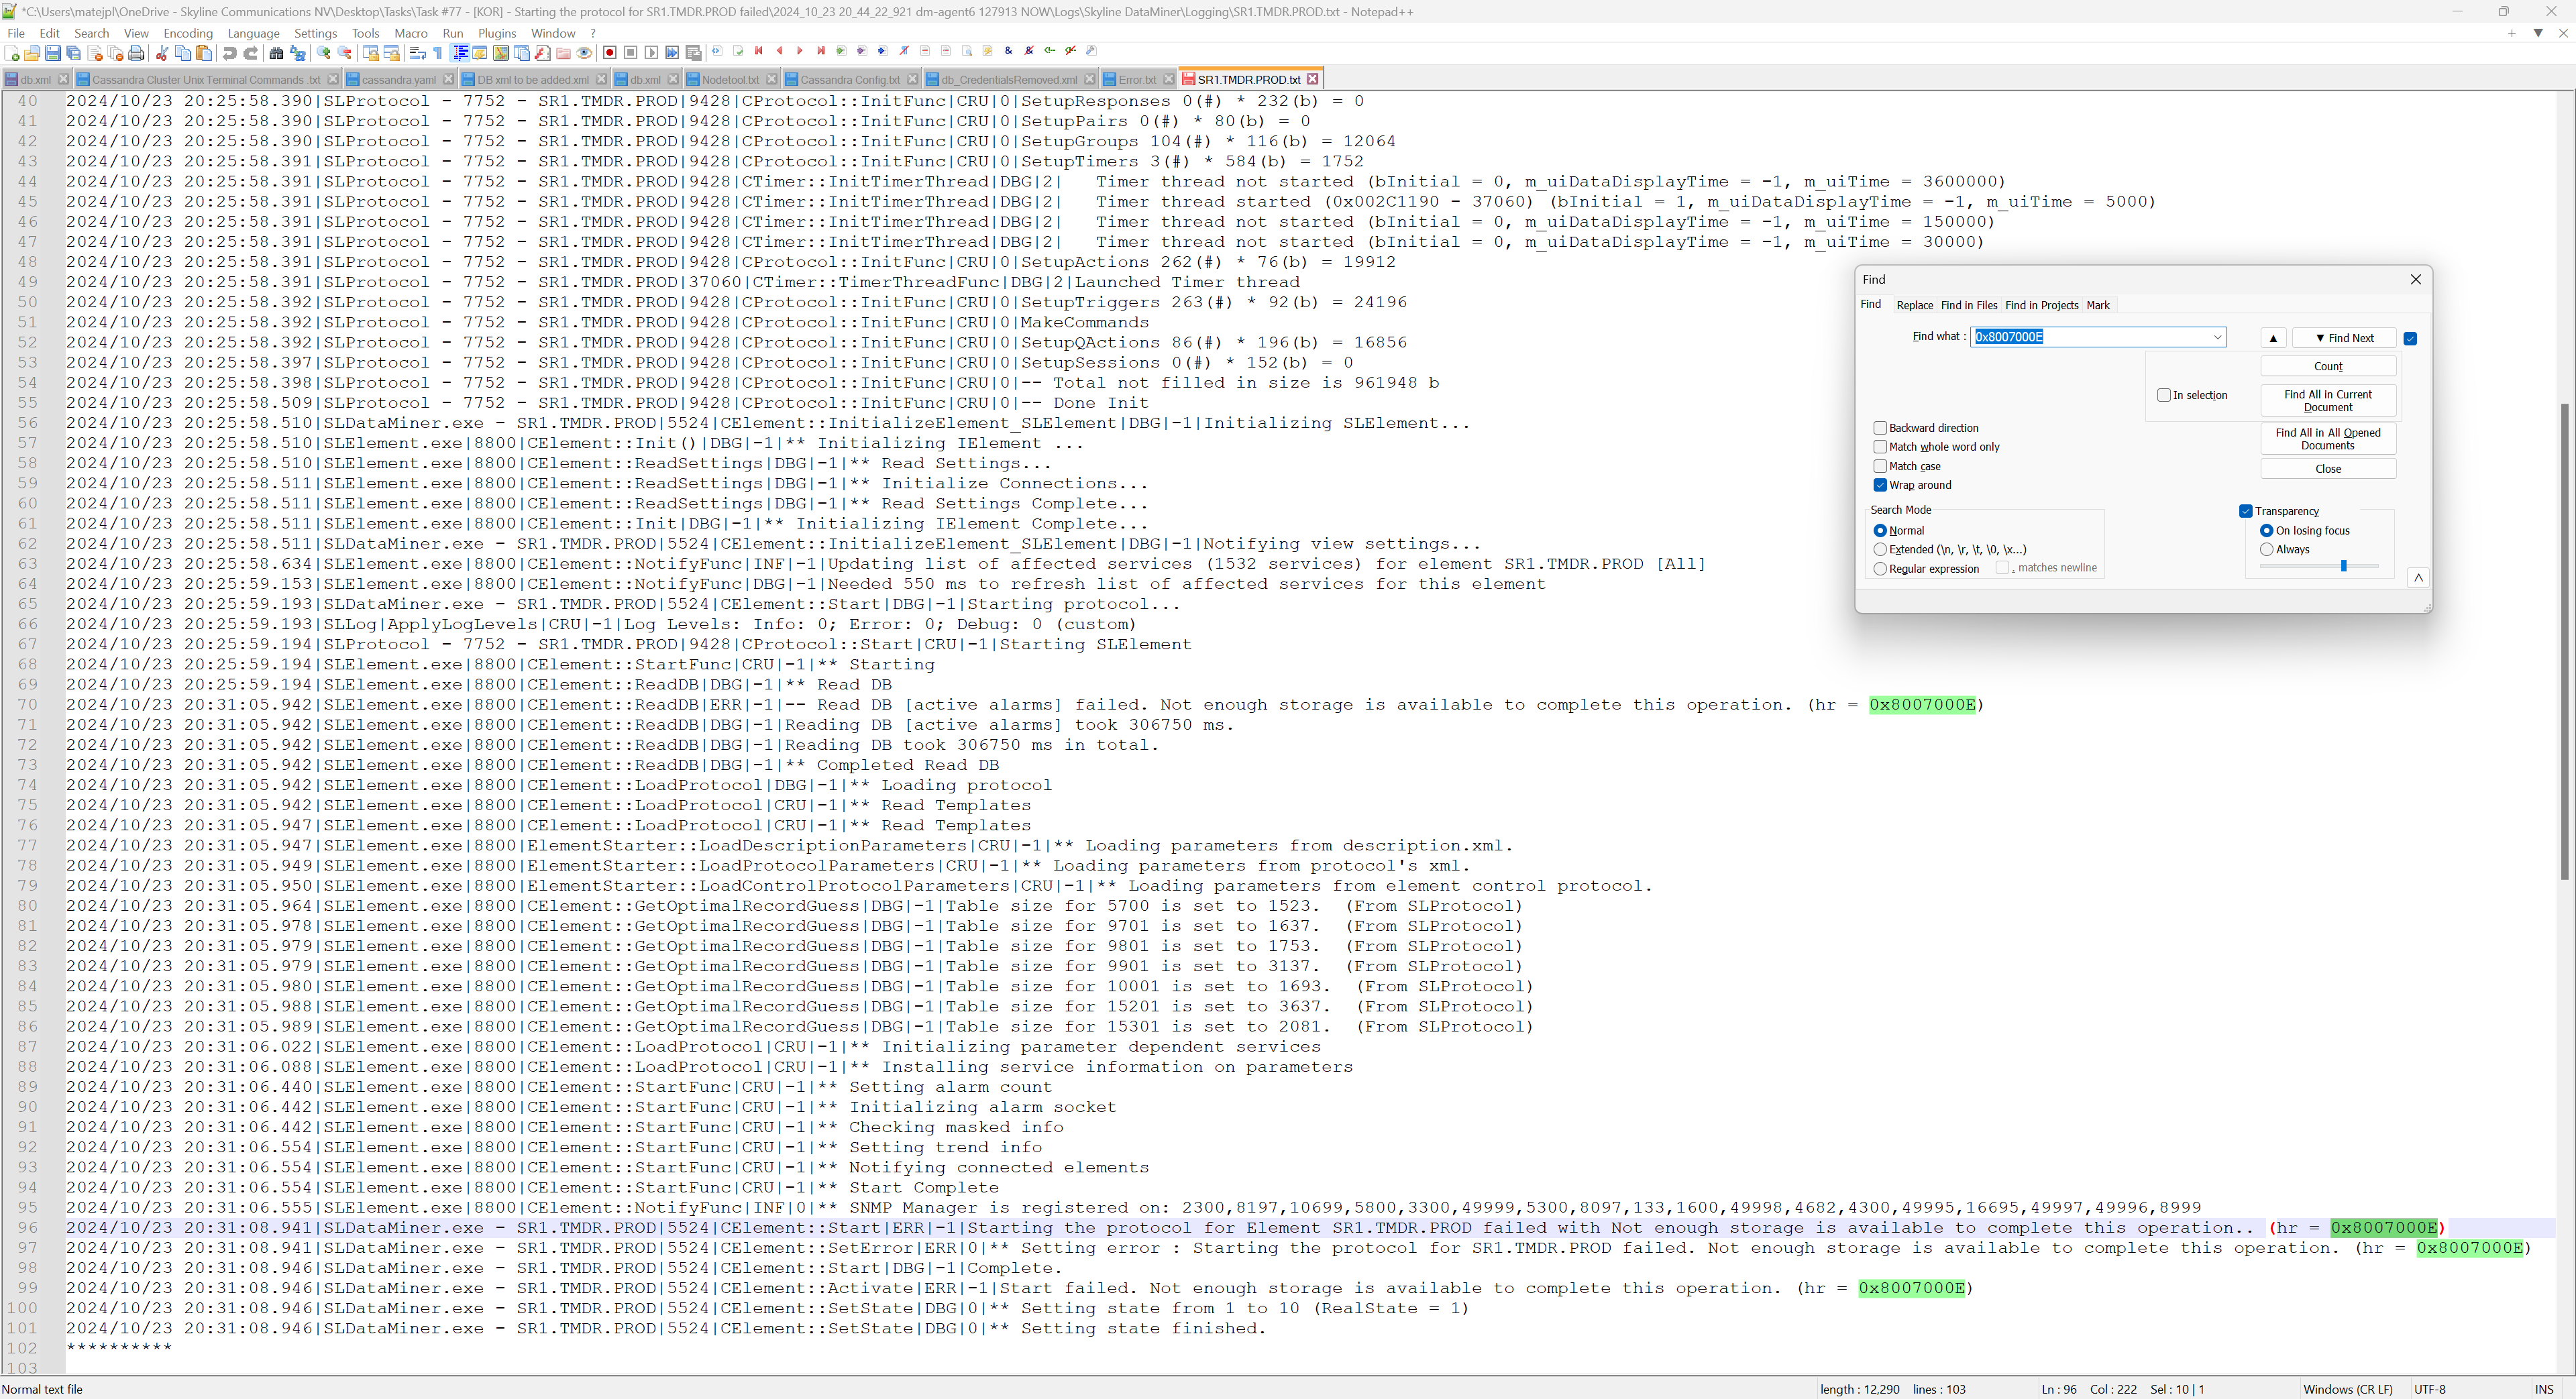
When the client tries to start the element in production, they receive the following error:
”
Starting the protocol for SR1.TMDR.PROD failed. Not enough storage is available to complete this operation. (hr = 0x8007000E)
”
Under element log I can see the same output from SLElement (64bit) and SLDataMiner (32bit) processes.

There are 10 other elements running the same version (Alcatel SR Manager) on that DMA server without any issues.
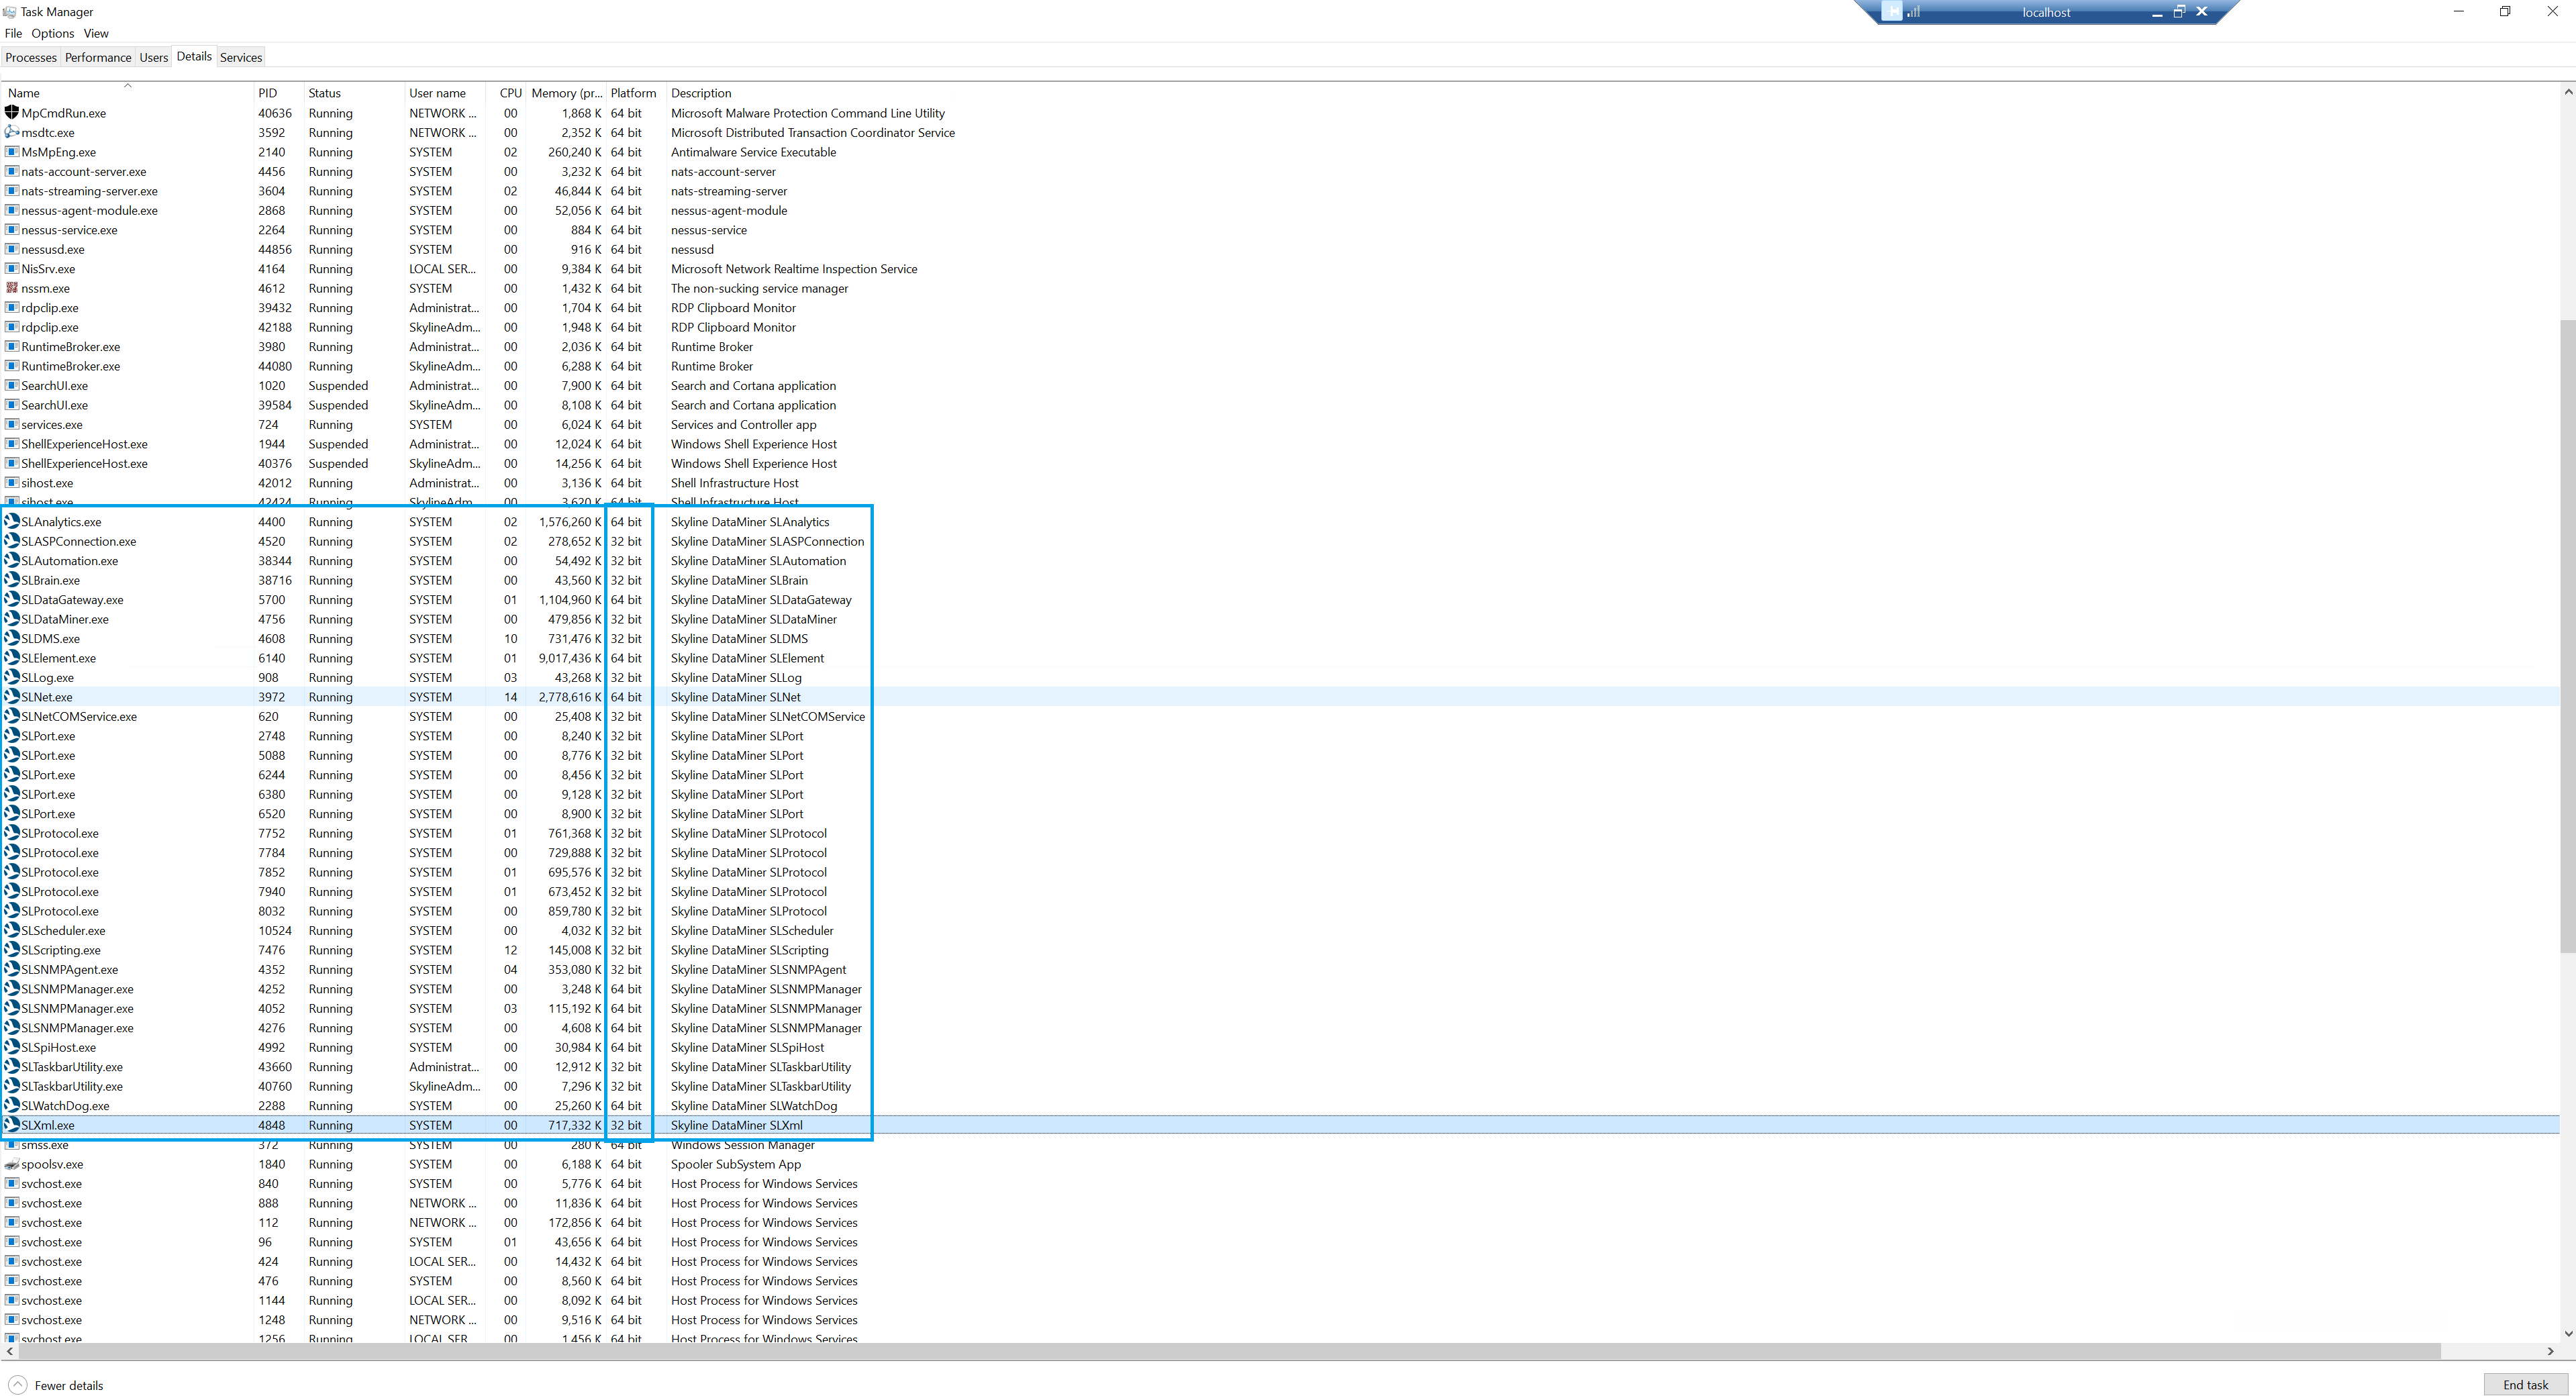
I’ve checked the 32-bit processes on the affected DMA server (SLProtocol, SLDataMiner, SLDMS, etc.), and none of them reach a memory usage of 4GB (the upper limit for 32-bit processes), with virtual bytes also well within limits.
SLElement(64bit process) memory usage is around 9GB, which is still lower than on other DMA servers in the cluster.
Note: The client restarted the cluster after the initial occurrence of this issue. However, after the restart, when the element was starting, the same error reappeared.
Here is the overview of DataMiner Processes (32/64bit):

Hi Laurens, thank you for your response.
There is ~200GB free on local C: drive.
In terms of DB, Cassandra Cluster is used. It consists of 20 nodes distributed across 2 data centers, with 10 nodes in each DC. More than enough space is left on each of those nodes as well.
Hi Matej
As it seems to be directly related to Not enough storage to complete this operation – DataMiner Dojo, I assume you also checked the provided RNs?
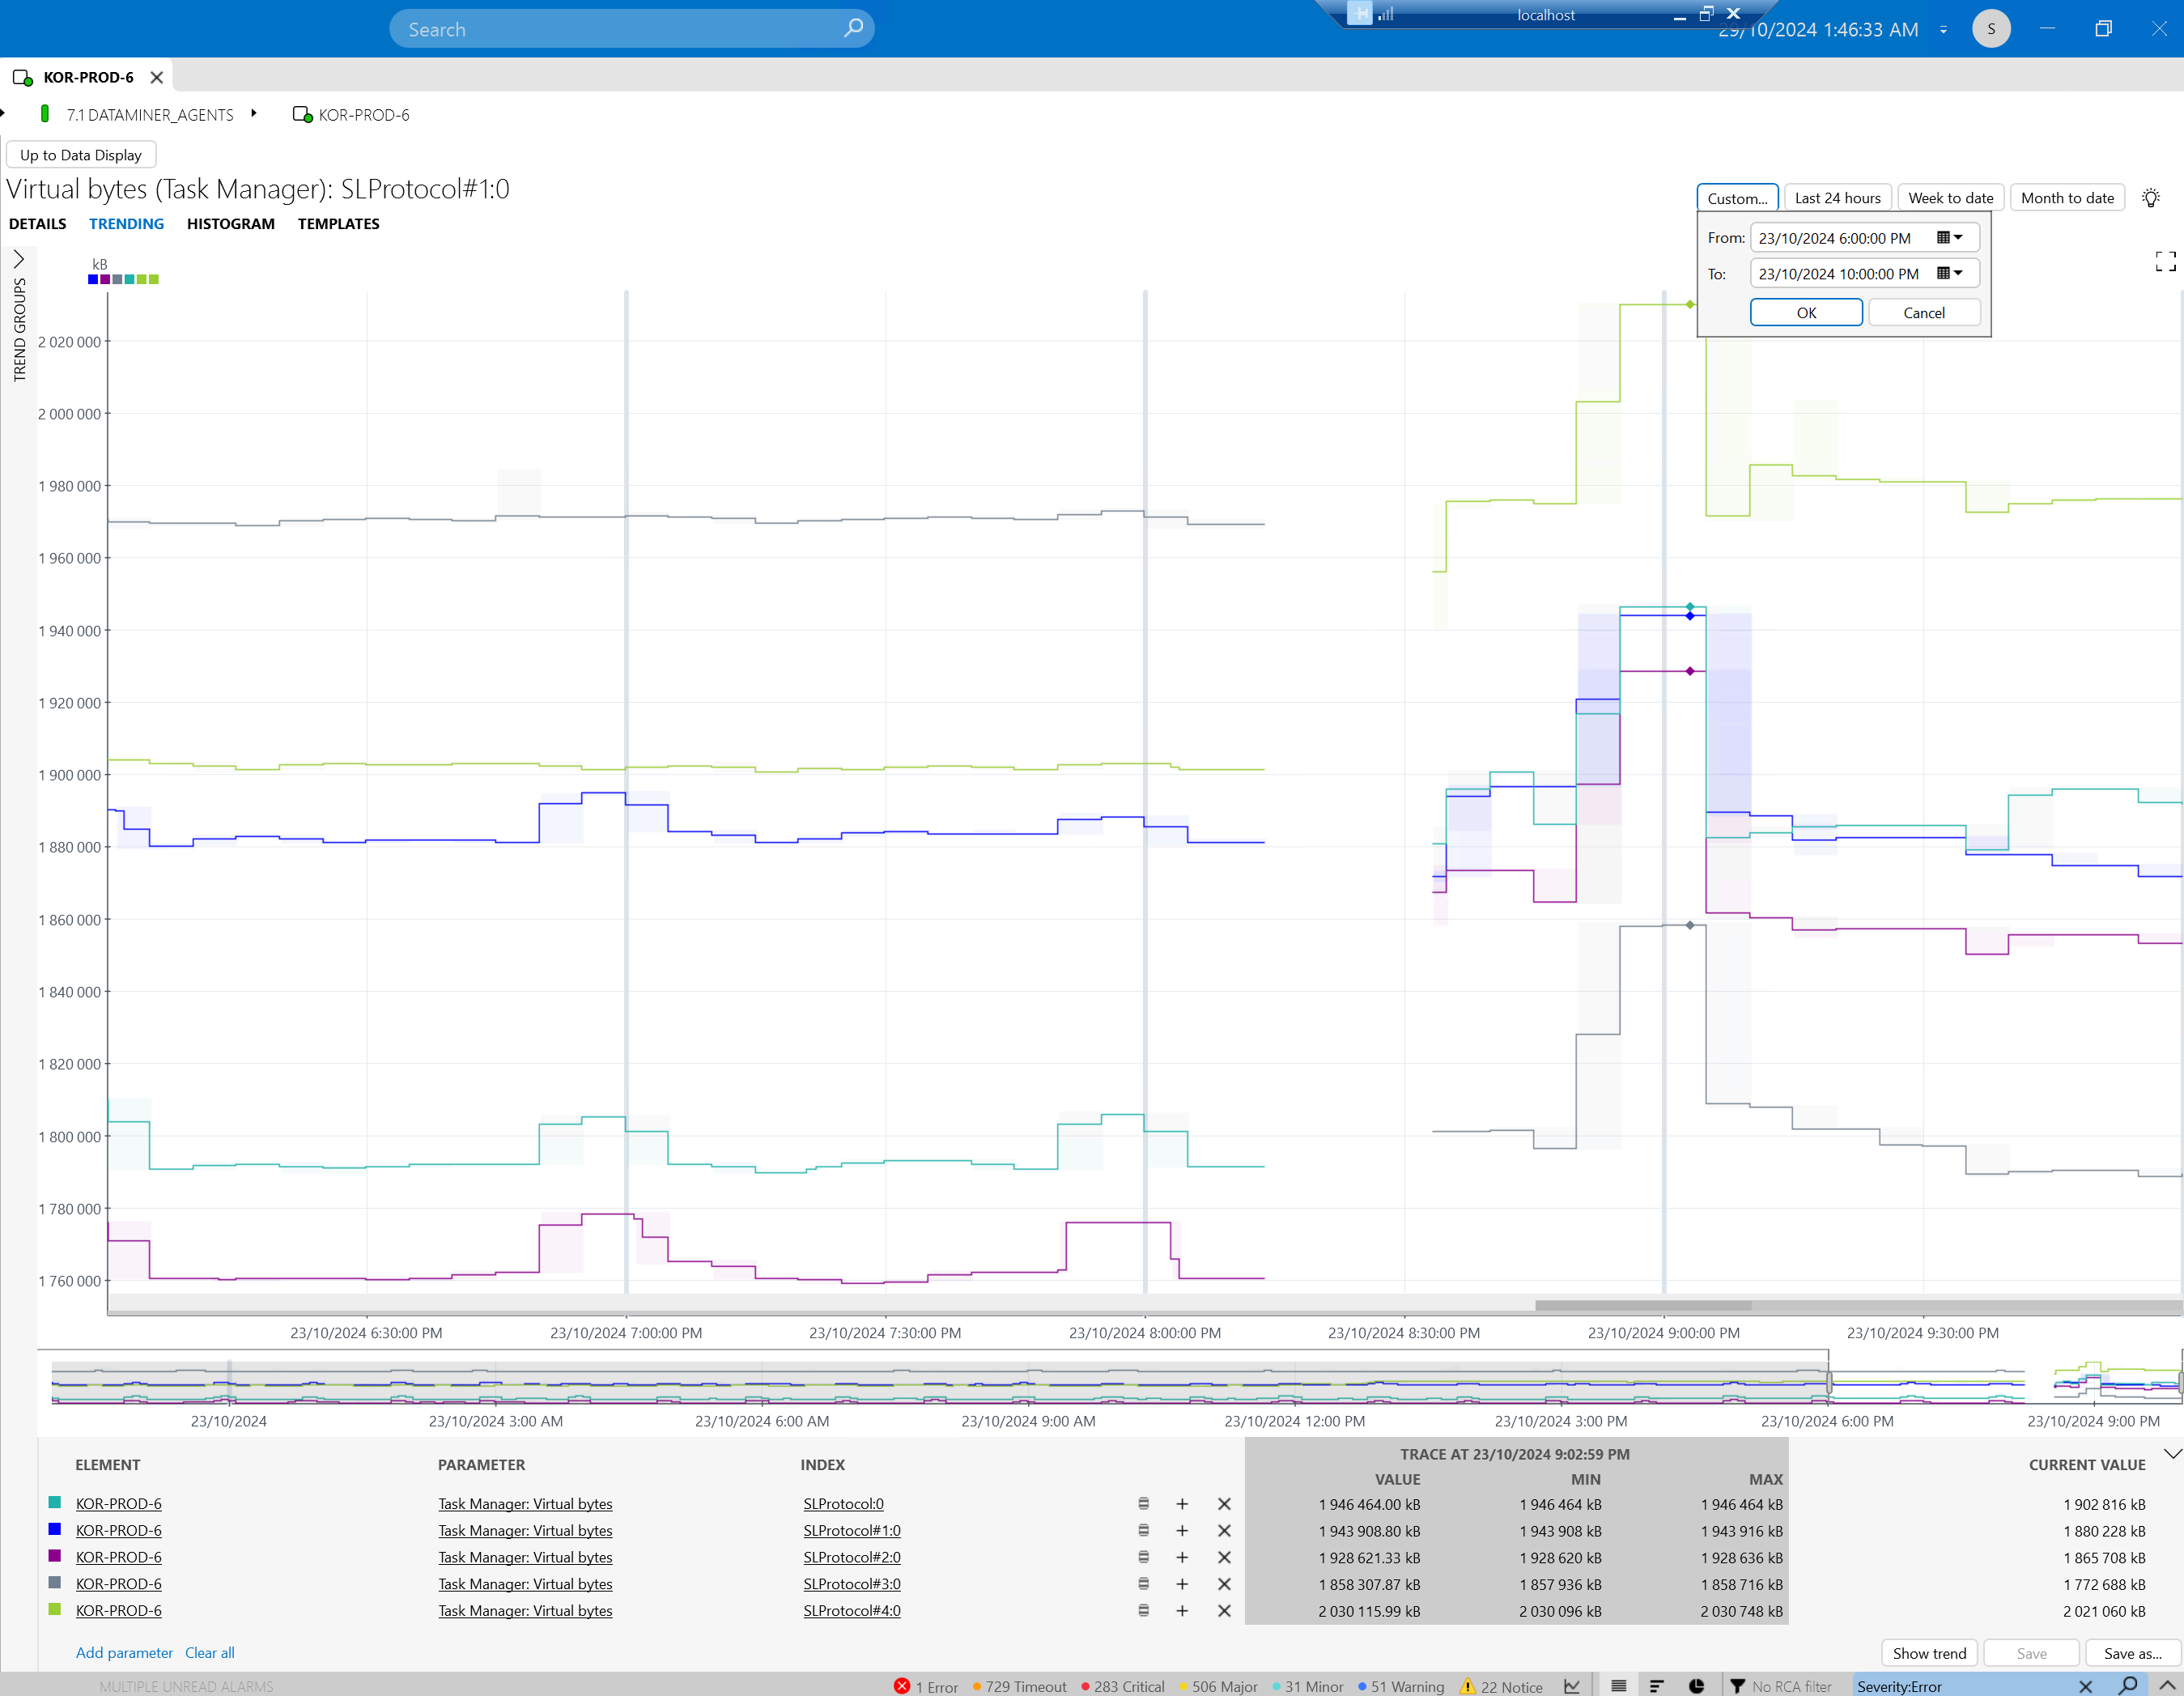
When checking the memory usage, did you check the Virtual Bytes, as Laurens indicated here? automation script – not enough storage is available to complete this operation – DataMiner Dojo
Note – it might be best to check this via the trending of the Microsoft Platform element
You mention the client restarted the cluster. What would you maybe mean that the DM got restarted which hosted this element? (no reboot?)
Is this a new or old element?
Are there any noteworthy differences between the 10 other elements?
Do these elements/protocols handle large data sets? e.g. large tables
Can you see anything in the element log? Anything out of the ordinary, e.g. reading the elementdata that takes a long time (although this would cause other issues)
If the above won’t help you, I would start looking into logs like SLDataminer, SLNet, SLDBConnection, SLErrors, SLErrorsInProtocol specifically on the time of occurrence.
Note – you can always contact techsupport@skyline.be for assistance.
Hi Robin, thank you for your answer.
I will post my answers to your questions in new dojo answer below, because I want to add figures as well.
Hello Robin (once again😄),
- Kordia is running DM version 10.3.0 – CU9, so it’s possible that the issues addressed in those RNs could still be relevant here.
- I also checked virtual bytes, and they appear to be within normal limits.

- The client has restarted the cluster multiple times since the issue began, including all DMAs and DMA6, which hosts this element, yet the error persists.
- The elements were created at different intervals; some of them are up to two years old.
- I’ve noticed that three elements on DMA6 have SNMPv3 and SNMPv2 configurations for the two connections, while the others use SNMPv2 for both connections. However, this doesn’t seem significant, as the other two elements on DMA6 with the same configuration (one SNMPv2 and one SNMPv3 connection) are operating normally.
- A ticket was created shortly after raising the question. Tech support suggested that we first try setting the SLProtocol processes to 64-bit, and if that doesn’t resolve the issue, to further increase the number of concurrent SLProcesses. More details are on the task. While no physical memory leak has been detected in SLProtocol in this case, backend operations may still be putting stress on the process. Converting SLProtocol from 32-bit to 64-bit is recommended as the initial step, as this change alone may resolve the issue.
I’ll provide a final update on whether this resolves the issue.
Thank you !
And is there free disk space available both in the C drive and the location where the database data is stored?