Skip to content
DataMiner DoJo

More results...

Generic selectors
Exact matches only
Search in title
Search in content
Post Type Selectors
Search in posts
Search in pages
Search in posts
Search in pages
Log in
Menu
  • Updates & Insights
  • Questions
  • Learning
    • E-learning Courses
    • Empower Replay: Limited Edition
    • Tutorials
    • Open Classroom Training
    • Agility
      • Kanban workshop
      • Agile Fundamentals
    • Certification
      • DataMiner Fundamentals
      • DataMiner Configurator
      • DataMiner Automation
      • Scripts & Connectors Developer: HTTP Basics
      • Scripts & Connectors Developer: SNMP Basics
      • Visual Overview – Level 1
      • Verify a certificate
    • Video Library
    • Books We Like
    • >> Go to DataMiner Docs
  • Expert Center
    • Solutions & Use Cases
      • Solutions
      • Use Case Library
    • Markets & Industries
      • Media production
      • Government & defense
      • Content distribution
      • Service providers
      • Partners
      • OSS/BSS
    • Agile
      • Agile Webspace
      • Everything Agile
        • The Agile Manifesto
        • Best Practices
        • Retro Recipes
      • Methodologies
        • The Scrum Framework
        • Kanban
        • Extreme Programming
      • Roles
        • The Product Owner
        • The Agile Coach
        • The Quality & UX Coach (QX)
    • DataMiner DevOps Professional Program
      • About the DevOps Program
      • DataMiner DevOps Support
  • Downloads
  • More
    • Feature Suggestions
    • Climb the leaderboard!
    • Swag Shop
    • Contact
    • Global Feedback Survey
  • Support
  • PARTNERS
    • All Partners
    • Technology Partners
    • Strategic Partner Program
    • Deal Registration
  • >> Go to dataminer.services

Show last two days in trend graph in Visual Overview

Solved551 views2nd September 2024trending Visual Overview
2
Tobe Deprez [SLC] [DevOps Advocate]894 29th August 2024 0 Comments

In Visual Overview (visio), I can add a trend graph of a parameter and show the last day of trending with the following options.

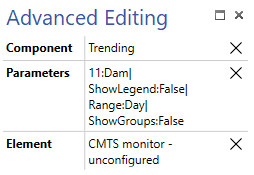
Is there a way to show the last two days instead of the last day?

Tobe Deprez [SLC] [DevOps Advocate] Selected answer as best 2nd September 2024

2 Answers

  • Active
  • Voted
  • Newest
  • Oldest
1
Toon Casteele [SLC] [DevOps Enabler]7.03K Posted 2nd September 2024 0 Comments

Here’s how to set it up. There’s 1 tricky part as you don’t want to update the range constantly with the current time. Therefore we need to first store the current time in a variable instead of directly using it in the Range of the chart.

On the page:

  • InitVar => [sep::$]Now$[DataMinerTime] (note the sep is necessary because in our culture DataMinerTime outputs a value with ‘:’ characters)
  • Options => PageVariable

On the trend graph

  • ParametersOptions => Range:Start=[subtract:[pagevar:Now],2.00:00:00],End=[pageVar:Now]

Relevant help links other than DataMinerTime and InitVar:

  • Trend component configuration
  • Subtract placeholder
Tobe Deprez [SLC] [DevOps Advocate] Selected answer as best 2nd September 2024
2
Matthias Declerck [SLC] [DevOps Advocate]2.77K Posted 29th August 2024 2 Comments

Hi Tobe,

You can specify a Range value if you add the shape data “ParameterOptions”.
More info: Linking a shape to a trend component | DataMiner Docs

Matthias Declerck [SLC] [DevOps Advocate] Posted new comment 29th August 2024
Tobe Deprez [SLC] [DevOps Advocate] commented 29th August 2024

Can I define that range in relation to the current date and time?

Matthias Declerck [SLC] [DevOps Advocate] commented 29th August 2024

For this, you need some visio magic. First you need a session variable which has calculated value “current datetime minus 2 days”. then you need to add that session variable as a start tiemstamp.
As indicated in the docs : “You can specify a start time, an end time or both (separated by a comma).”

Please login to be able to comment or post an answer.

My DevOps rank

DevOps Members get more insights on their profile page.

My user earnings

0 Dojo credits

Spend your credits in our swag shop.

0 Reputation points

Boost your reputation, climb the leaderboard.

Promo banner DataMiner DevOps Professiona Program
DataMiner Integration Studio (DIS)
Empower Katas
Privacy Policy • Terms & Conditions • Contact

© 2025 Skyline Communications. All rights reserved.

DOJO Q&A widget

Can't find what you need?

? Explore the Q&A DataMiner Docs