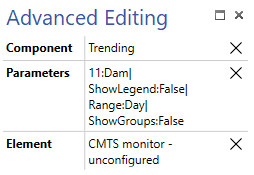
In Visual Overview (visio), I can add a trend graph of a parameter and show the last day of trending with the following options.

Is there a way to show the last two days instead of the last day?
Hi Tobe,
You can specify a Range value if you add the shape data "ParameterOptions".
More info: Linking a shape to a trend component | DataMiner Docs
For this, you need some visio magic. First you need a session variable which has calculated value “current datetime minus 2 days”. then you need to add that session variable as a start tiemstamp.
As indicated in the docs : “You can specify a start time, an end time or both (separated by a comma).”
Can I define that range in relation to the current date and time?