Dear community,
we have a 3 node cassandra cluster with one Dataminer (the lab one) hooked on it. We monitor it by the Apache Cassandra Cluster Monitor connector. We have also installed the Cassandra Reaper that is periodically checking (and hopefully) fixing the tables.
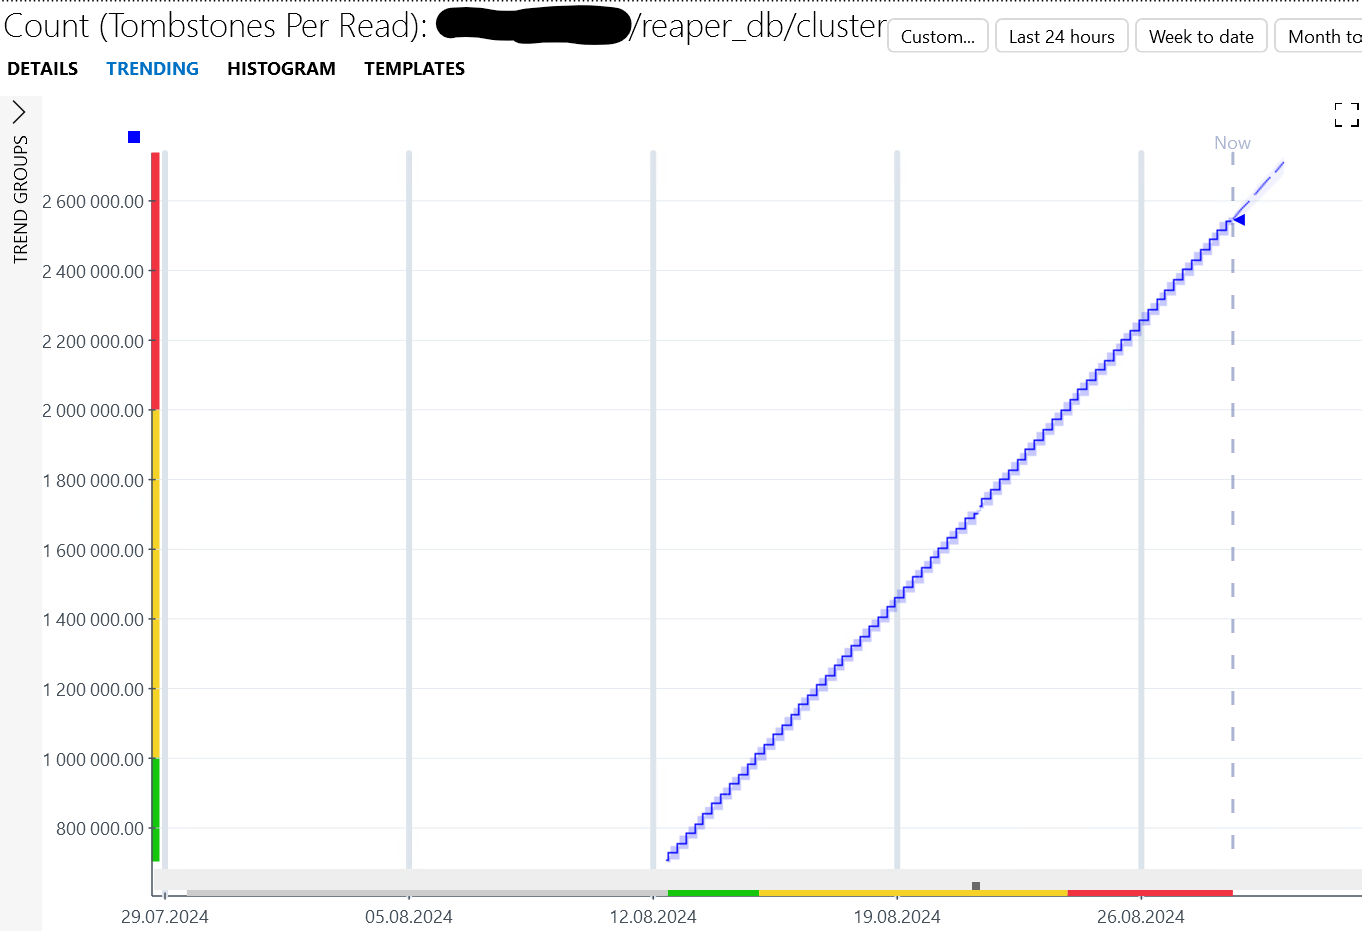
And we see tombstones are growing for some tables. Mainly the tables of the non Dataminer keyspaces – reaper_db, system_auth, system. These are growing linearly like this one:

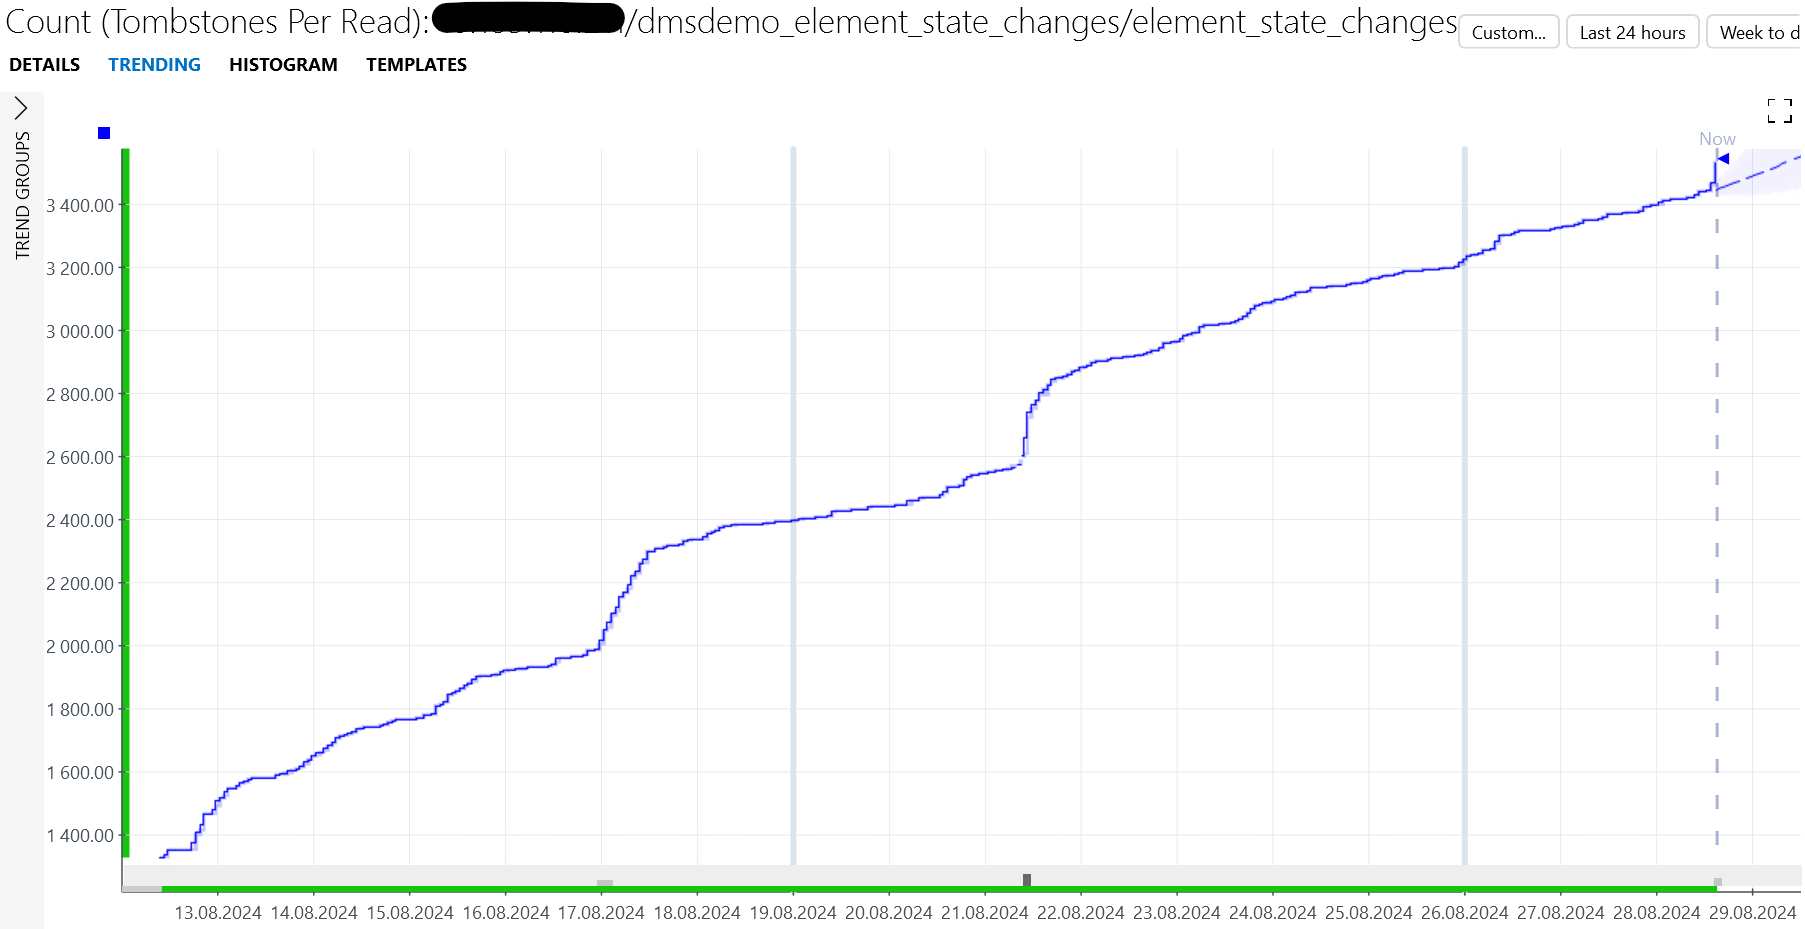
But there are also some tables of Dataminer keyspaces that seem to grow without any control:

Can you please advice what we could be missing in setup of our Cassandra cluster that would manage the tombstones count in a healthy limits?
Regards,
Milos
Hello, I have checked the catalog and there is no update of the protocol. At least, the misleading % unit is still there.
Indeed, I've checked with Michiel and the task is currently still on the backlog. We will post an update here when it has been taken care of.
It is expected that the count will continue to increase as this is a counter (similar to packet counters in switches). The columns that might be interesting to understand if your tombstones keeps on rising is the Max and Percentiles columns. These will indicate what percentage of data was tombstones that were received when during reads towards the DB. As it is only registered on read it could be that you have many tombstones, but they only can be noticed when you perform a read. For example, for elementdata you will see a spike when restarting an element (that has a lot of table updates) as then DataMiner will read the data from DB to start up. The Max, Percentiles columns are for the last 5 minutes. FYI under the details section when double-clicking a cell or parameter you will find a description. In addition, from Cassandra 5.0 we will be able to read the logging which will be a better way to understand tombstone problems.
In short to know if you have a tombstone problem, look at the max trending for spikes to see if your spikes keep on raising.
Hi Michiel, thank you for your answer.
I restarted 3 elements and I’m observing this

How to interpret these values? There is 1000% of thombstones? I’d expect this value to be up to 100.
One more to ask if possible – what do you mean by “looking at the max trending for spikes”?
Regards,
Milos
I’m doubting actually if it should be % or if it is just nbr of tombstones encountered. I’ll try to figure it out, there is not much information from Cassandra (https://cassandra.apache.org/doc/stable/cassandra/new/virtualtables.html). What I mean with spikes is that after a while you will see the number drop again for the max, 99 and 95 as no reads are done anymore. So if you look at the trending of those values you will see spikes typically when DM or element restarts are triggered. If those spikes keep on increases over time in the trend graph it means that more and more tombstones are encountered on reads and it might lead to issues. To know if it would cause an actual issue we would need to check the logs of Cassandra to see if there are any errors on tombstones (From Cassandra 5.0 we will be able to get this info => https://issues.apache.org/jira/browse/CASSANDRA-17948).
Thanks.
If you would know more about the Maximum and Percentiles columns (what in fact it speaks about) please note it here.
With Cassandra 5.0, will you present the logging info by the Cassandra Cluster Monitor connector in the Dataminer?
Sorry for the late response on this. It is indeed the max number of tombstones scanned during a read (based on the percentiles). I created an issue task on the backlog to remove the unit (%) on those columns. We indeed plan to have functionality available in the connector to read out the Cassandra logs (so you can alarm on errors in logs). If you have an ongoing M&S contract with Skyline feel free to add a FR under the M&S project in collaboration.
I see that this question has been inactive for some time. Do you still need help with this? If not, could you select the answer (using the ✓ icon) to indicate that the question is resolved?