Dear all,
I would like to know if there is any way to work with layers on the dashboard or create more elaborate drawings. For example, I would like to make a 42U rack to place the elements. Is this possible on the dashboard, or do I need to use Visio for that?
As this question has now been inactive for a long time, I will close it. If you still want more information about this, could you post a new question?
Hi,
We have some features in Dashboards & Low Code Apps that make creating custom visuals possible:
- The web component can be used to create a custom visual. You can link some feeds to insert data & apply dynamic styling based on the data.
- The grid component can be used to insert a template for each query row returned from a query. The templates on this component can be used to style each item based on the data. Text shapes also allow HTML to be used, so the styling is very customizable.
- The visual overview component can be used to insert Visio’s into the dashboard itself.
All these components can be used to achieve the same result in different ways. Visual overview makes the drawing side of the result very easy with its drag & drop shapes while the grid can leverage GQI to easily retrieve data (based on some feeds).
This is an example that was made using the Grid component:
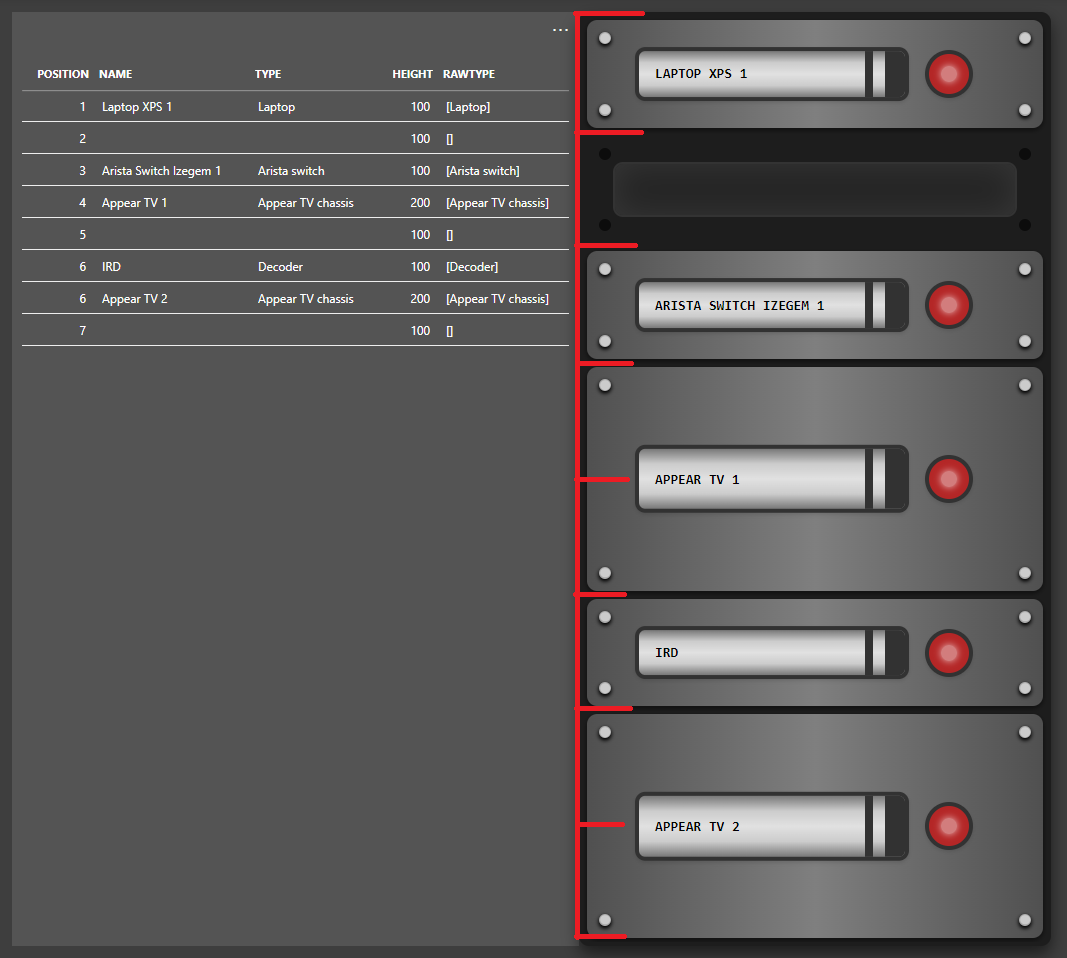
Some explanation:
- What are the rack units?
All rack units in the grid are fully built using HTML in a text shape. - How are gaps achieved?
The data that is used in the grid is structured a such that empty rows in the rack are also included. Conditional cases were added based on the ‘RawType’ column that decide what shapes to show & hide in the template. When the ‘RawType’ is ‘[]’, no rack unit is shown. - How is the different height achieved?
The height is based on the ‘Height’ column, which is also included in the data. together with some custom styling in the text shape, some units can span multiple spaces. Note that after each unit that is > 100, an empty row is included because all templates have the same base height. The higher units give the illusion that they are bigger by covering multiple empty spaces as well. I have indicated in red how many grid items there actually are to make this more clear.
=> When creating a real-life based rack layout, the data that the visual is based on is very important.
I’ve seen somebody accomplish that with dynamic grids.
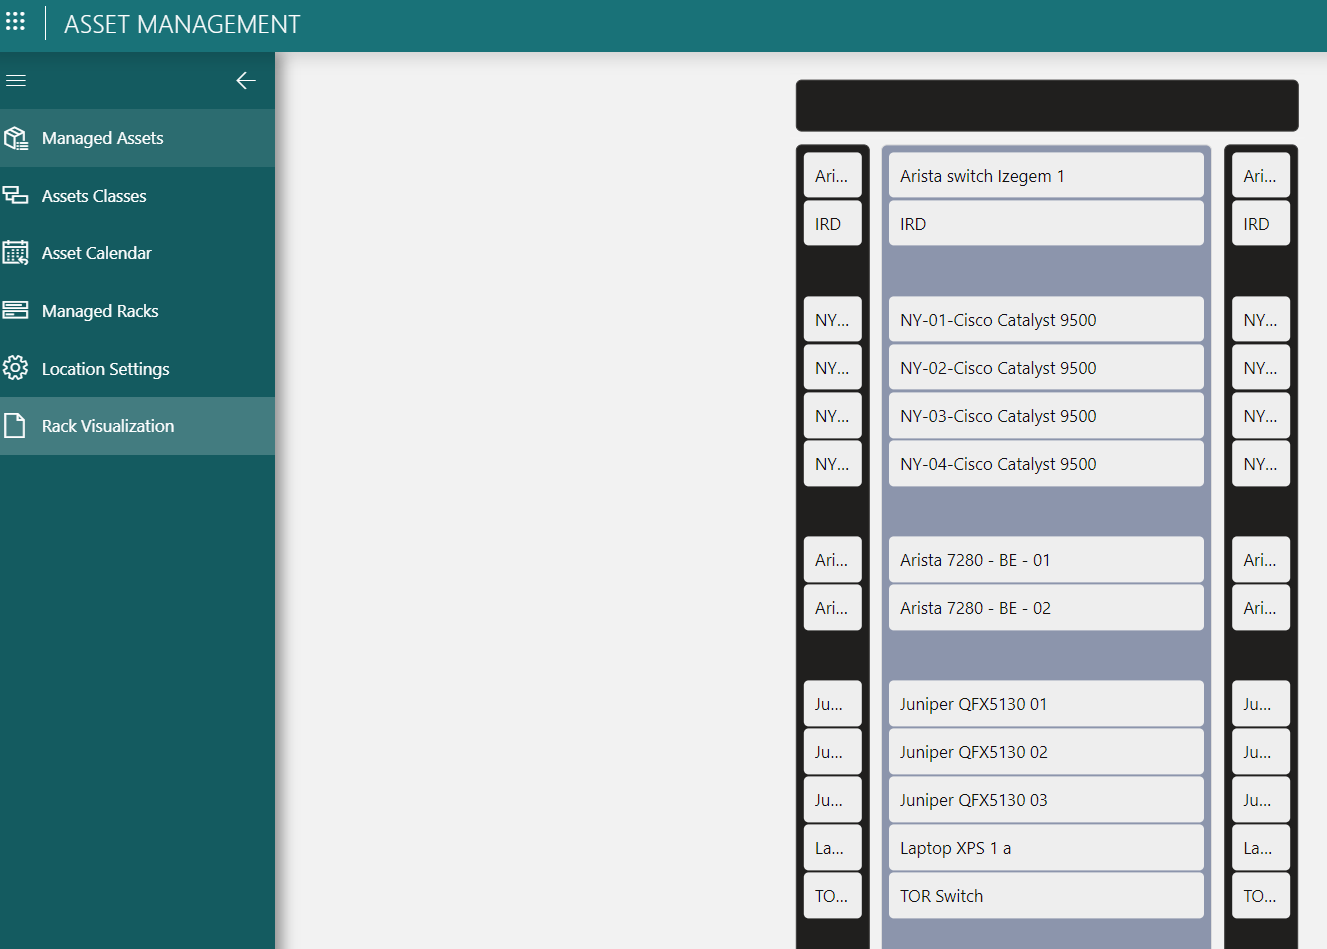
For very complex illustrations, you can also still rely on Visual Overview and there’s a component in the dashboards to display a Visual Overview graphic.
Note that every block in there could be further customized. Now it only has the name of the element, but it could also have like an alarm indicator and other information.
Hi Ben, we´re working together with Rubens on this project. THank you for the examples.
As a matter of fact, we´ve tried the dynamic grid aproach, it works fine but we could not arrange and choose the order and position for the groups of elements there.
Could you please tell us how they adjusted the positions and spaces in between the elements on example shown?
Regards
Hi Euler, I have added some explanation on how this can be achieved to my answer. The example that Ben has included probably uses similar tricks.
I see that this question has been inactive for some time. Do you still need help with this? If not, could you select the answer that has been most helpful for you (using the ✓ icon)?