I am attempting to make a LowCode App that is a penalty box for specific services alarms. The issue I am running into is, with an alarm table, you can add the services as a filter, but we have not found a way to allow the acknowledgement of the alarms. If we use a regular table, you can add a query filter for alarms but we have not found a way to only show the services alarms we want which would then allow us to use an automation script for acknowledgement. Any insight would be appreciated!
Hi David,
Great use case! We tried this out and took the approach of an ad hoc data source in combination with some visuals in a Low-Code App.
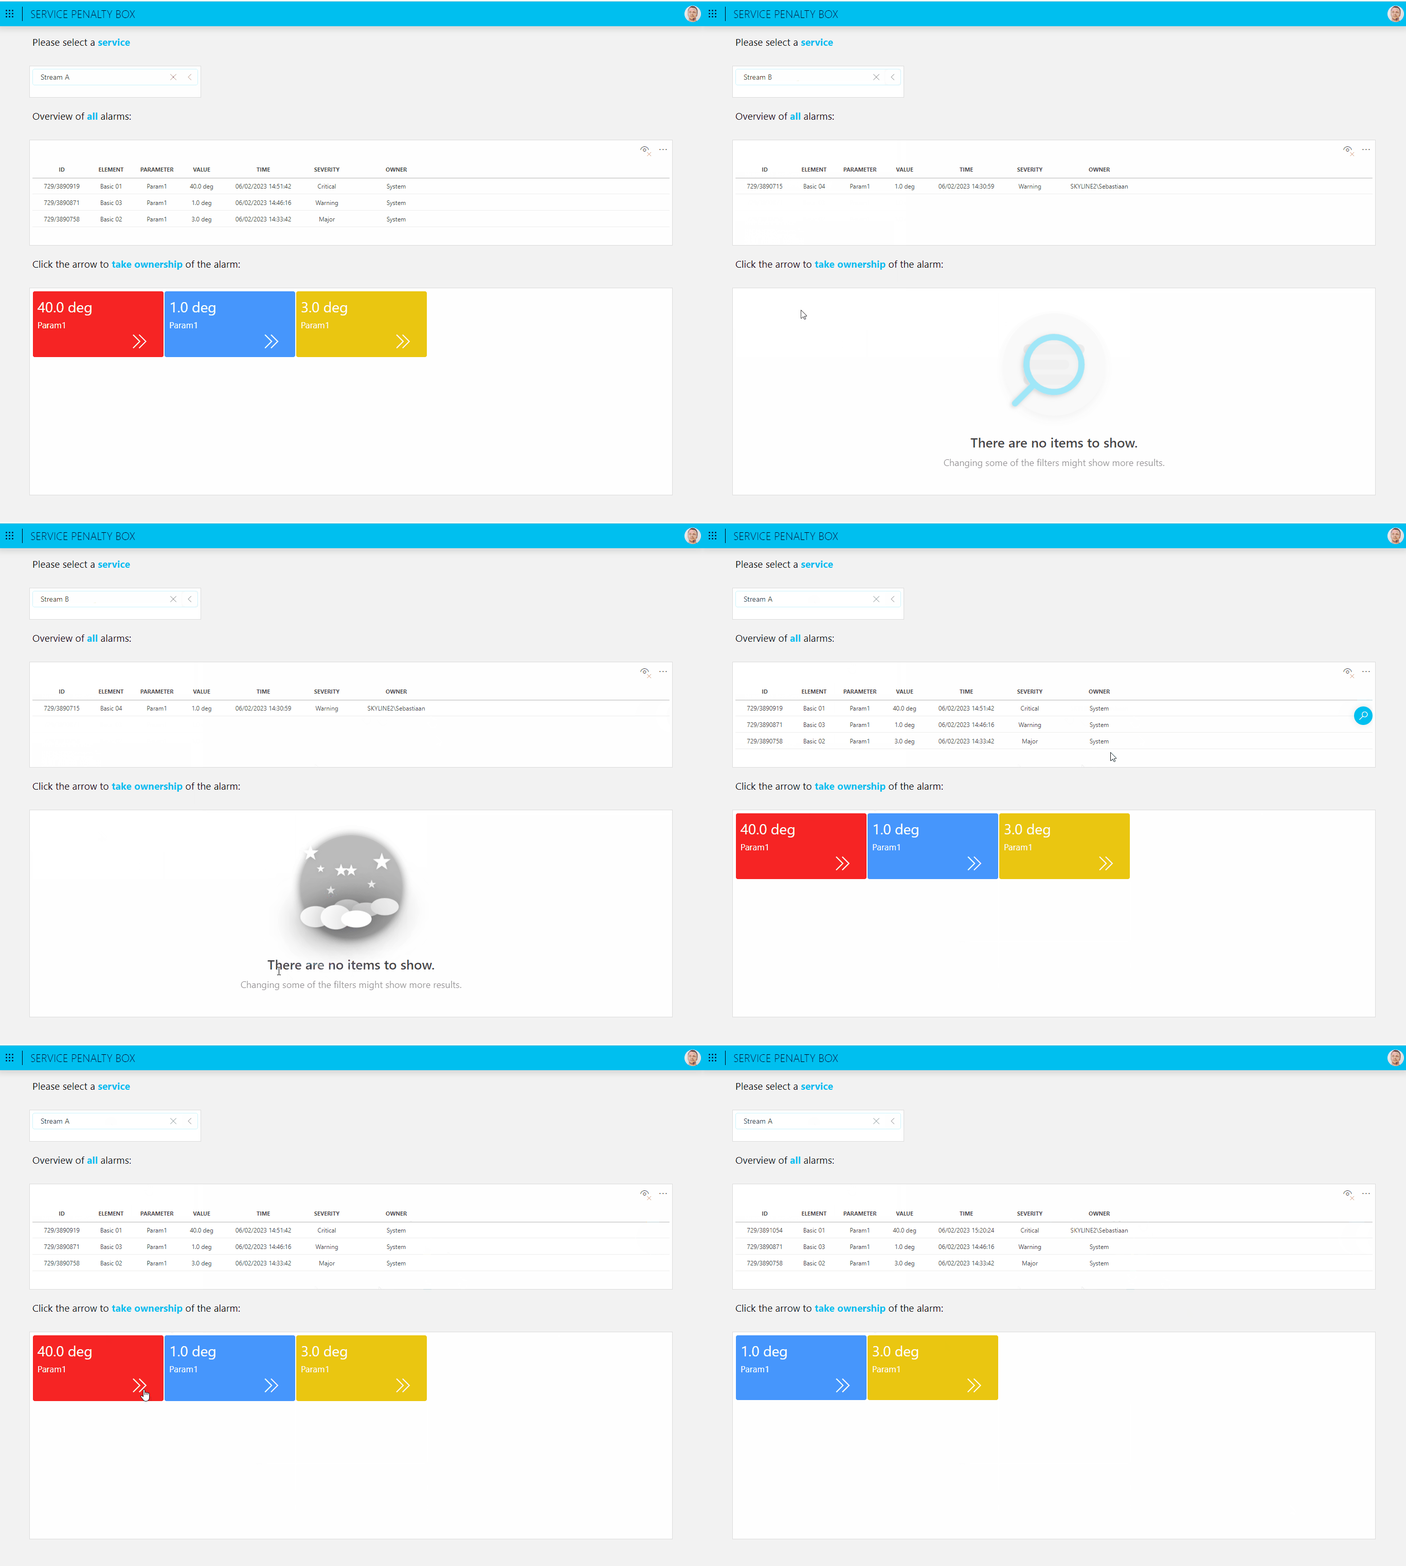
Here’s how the page is set up:
- Let the user chose a service.
- The table below that dropdown is listing all alarms for the selected service.
- A grid displaying all unacknowledged alarms.
- Inside this grid there is a button that lets the user take ownership of an alarm.
- After doing so, the table and list is refreshed.
A small demo:

So where is this data coming from?
Well we developed an ad hoc data source (see docs) that accepts a service name. This data source then requests all active alarms for that service from DataMiner. Additionally, we can filter on the owner in GQI as well.
I’ve made the source code for this ad hoc data source available on GitHub: https://github.com/SkylineCommunications/SLC-GQIDS-ServiceAlarms/blob/main/GQIDSServiceAlarms_1/GQIDSServiceAlarms_1.cs
Let me know if you have any questions on this!
Hi David – just wanted to check in and see if you managed to get what you were after with this input from Seba?
My apologies! I am just now getting back to this and did not see any email notification for this reply. This is amazing! I will definitely check this out. Thank you Seba!
How are you using a table with the dropdown menu? I am only able to get an alarm table to work.
Not exactly the same, but Seba also recently has put a generic service dashboard on the catalog. If your DataMiner System is cloud-connected, you can put it on your system via the DEPLOY option. Again, not exactly what you were looking for, but maybe of interest to learn from. https://community.dataminer.services/the-services-overview-dashboard/
David – not sure if it will get you where you want to be, but just so you are aware, there are currently two methods to work with alarms. One is the dedicated Alarm Table widget, and the other one is to create a query (create a query, choose Get Alarms, use a Select to choose which information you want for the Alarms (e.g. element name, parameter name, ownership, service impact, etc.). This will generate a table for example (drag and drop your query on the canvas and use the table widget for graphical presentation), and with the queries (GQI) you can then do quite a bit of manipulations and all that. You can also do then a count for example of the nbr of records and choose to display that as a nbr (instead of a table with the alarm data records). Maybe this can help you achieve what you are after?
Hey Ben,
Thank you for your answer. This issue I am having using a table with a query is filtering for specific services. If I can figure out a solution to only filter for the specific services alarms we want, then I can use a table with an automation script to allow for the alarm acknowledgement.
Indeed, I see where you are stuck. And if I get it right, what you want to achieve is that you have a feed with your services, one can select a service, you want to then show all the alarms affecting that service, and you want to have the option for people to then ACK one or more of those alarms in front of them. Correct?
Asked around a bit, and there will probably be a solution for this. Stay tuned, they will circle back on this.
Thank you Ben! I really appreciate your help. We will definitely check out Seba’s solution.
Awesome Seba – you rock. Thanks for sharing that!