Hello
My client is requesting a report by email which shows a graphic for multiple servers for a single KPI (for example: CPU).
In the present, what is the best approach to achieve that in your opinion?
Thank you.
Best regards
Bruno Sousa
Bruno,
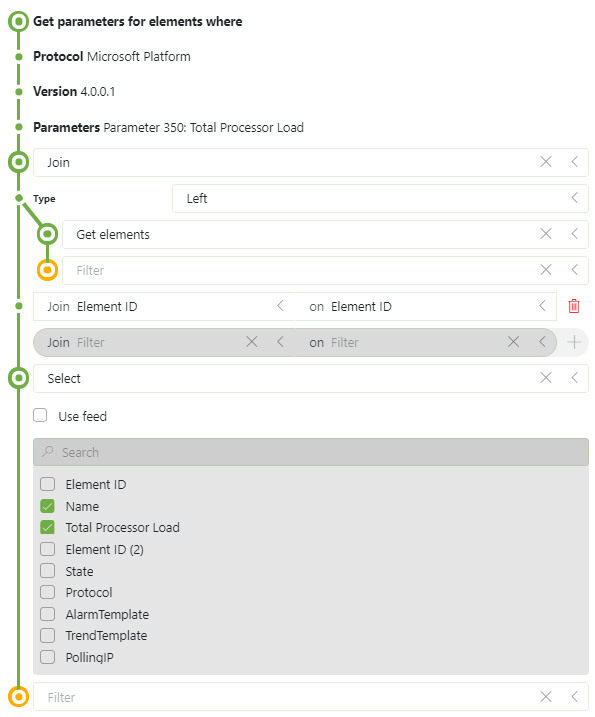
Here is an example of such a join in the query.
This is how you go from your initial query to this one:
- Add a join node
- specify the data source you want to join (optionally you can filter, … this branch till you have a table ready-to-join). In this case I’m joining the full element table. I choose for a ‘left’ join as I only want rows from my initial (left) table.
- In the join node, you also need to configure the ‘linking’ between the two tables, so basically the columns in the left and right table that hold the same information. In this case this is the ‘Element ID’ column which we have in both tables.
- At the end of the query, I have added a ‘Select’ node to limit the number of columns in my result and I shifted the Name columns in front of the ‘Total Processor Load’ column.
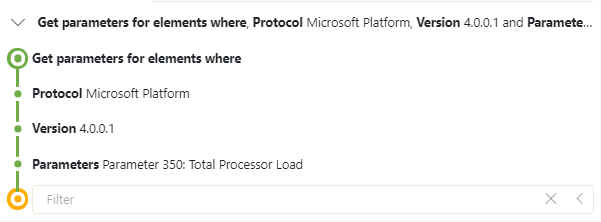
Miguel showed you how you could achieve a time series chart for your parameters. In case you want a snapshot of the current value instead, you can take the GQI approach with a query like:
and visualize the result in one of our chart visualizations:
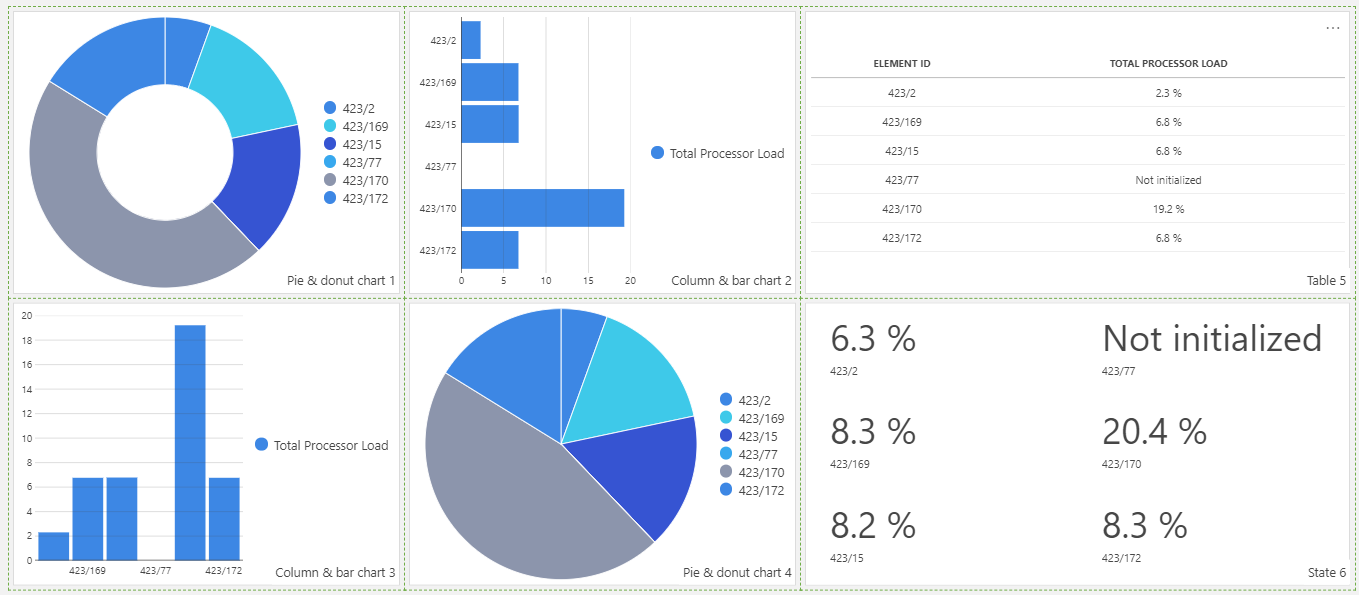
PS: with a join of Element data in your query you can have element names instead of IDs.
Next to displaying the current value, you can also calculate statistics based on the trend info, like the average value over time for example (currently still restricted on one element, but will be extended soon). And we have some more extensions coming up (10.1.8 – 10.1.9) like time patterns where you will be able to filter on business days/hours for example.
If you want to have it sent by email then, you can follow the same last step Miguel mentioned.
Thank you both for the suggestions!
1. I don’t see a way to filter by element on the line chart.. maybe I’m doing something wrong? I’m using Dataminer’s last version 10.1.7
2. Pieter, any example on how to perform the join that you mention, to get the Element name instead of the id?
Thank you.
Best regards
Bruno Sousa
see separate answer (as I wanted to insert images, which I can’t do in a comment)
Hi Bruno,
I believe that the best way to generate this report is using the Dashboard app. Please find below the steps that should cover your use case:
- Create a dashboard that contains the component Line Chart. See DataMiner Help (Line & area chart) for additional information about charts
- In the new dashboard, as data source, select Parameters. In the filter options select:
- From: Protocol
- Protocol: The name of the protocol
In the example below, I added the parameter Total Processor Load from the connector Microsoft Platform: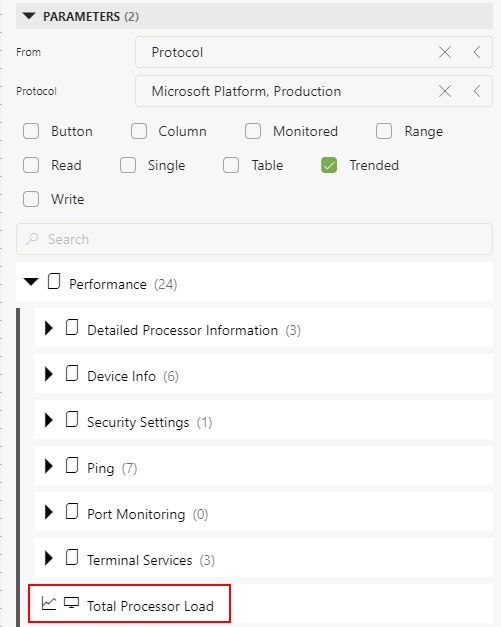
- Add this selection to the line chart component
- For filtering select Elements. In this case add to the line chart component the elements that will be included in your report
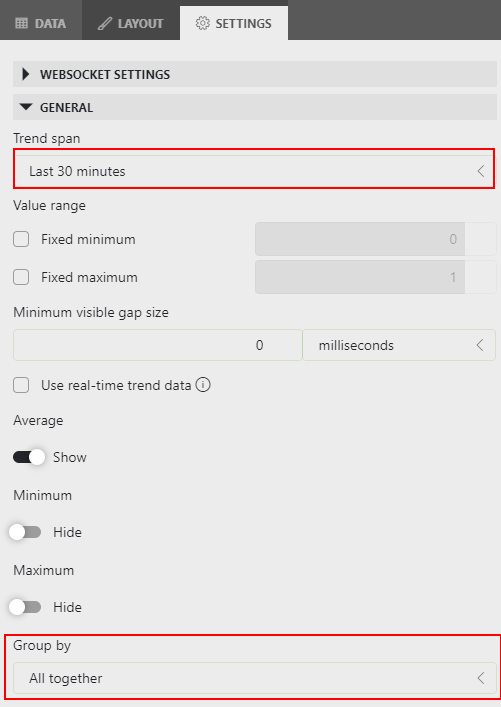
- Select the component and go to Settings:
- If required, change the timespan according to your requirements
- In the option ‘Group by’, select the option ‘All together’. This will display all the lines in the same chart:
- Finally, generate the report based on the dashboard. You can find in DataMiner Help – Generating a report based on a dashboard additional information about how to generate this report
It worked!
Thank you for the help, Miguel!
Best regards
Bruno Sousa
Really nice!
Thank you for the help Pieter!
Best regards
Bruno Sousa