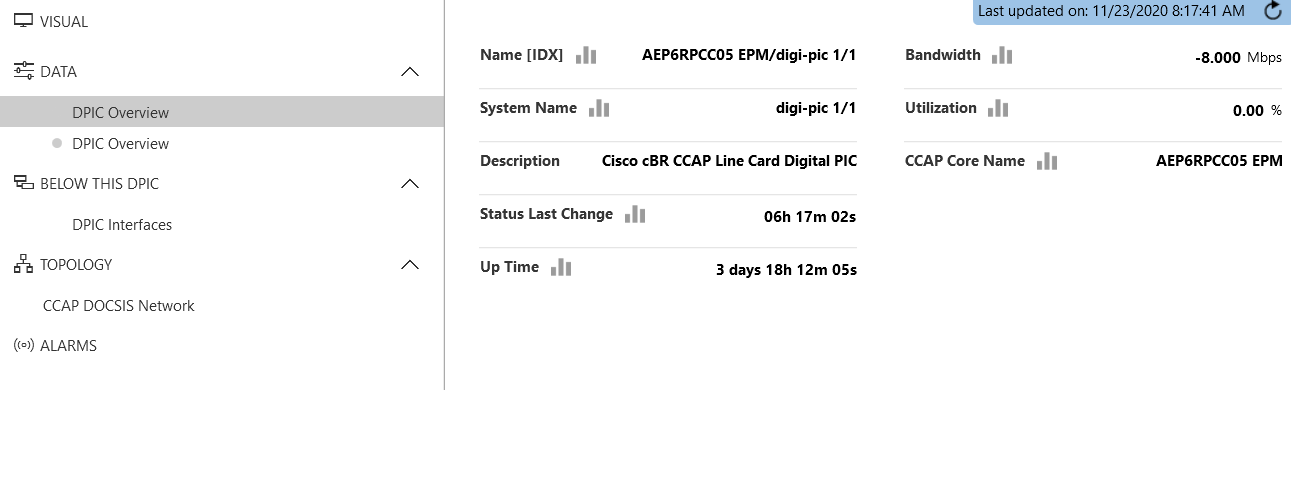
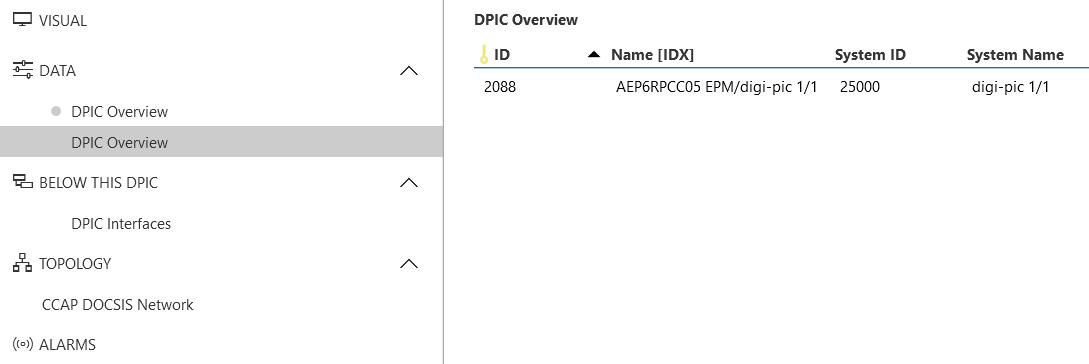
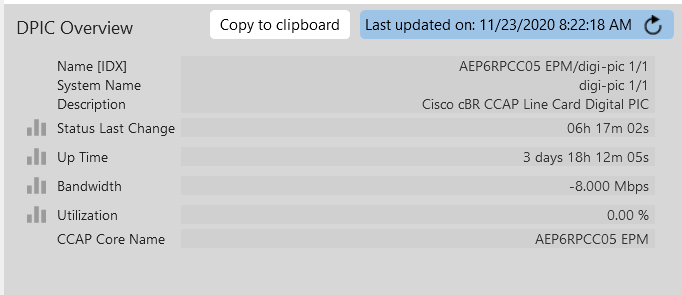
I am currently working on an EPM Solution and am getting what seems a weird visual for only two levels in a topology. When using the topology application under the surveyor, when selecting these levels and opening up their data card, for some reason, under the data section, there are two overview sections, one with the KPI's from the view table and the other overview page has the local table with only one entry.

I tried looking into documentation into what determines where this data is derived from in the code and it seems the chain is correct since when going through the topology in the FE driver itself, the data card only shows the KPI's from the view table and the local table is shown nowhere.
In a similar vein, I have a Quick search topology and one of the fields is the Manufacturer field that is not attached to any topology and is a standalone level, and when I search for it in the topology driver, the KPI's show up, yet when I search for it in the topology app, the data card does not open and is unresponsive, so not sure where in the code determines that the level will have a data card and what is in it.
Any help would be appreciated, thank you!
The EPM card will display the KPI's displayed in the 'classic CPE/EPM manager' plus data from all rows linked to that object (either via viewImpact or via cell exposers). Duplicate rows (direct view tables and the base tables) are filtered out if they come from the same table, or a view table on that table, within the same protocol and with the same primary key. Your screenshots would suggest not all these conditions are met. If the data is coming from a different protocol, only the source protocol should have the cell exposers.
The unresponsive card sounds as an issue, this should never happen, even with an unsupported configuration. Can you collect all information (especially reproduction steps on a preferably local DMA) and create a task for this? You can assign it to the Nucleus squad for investigation.