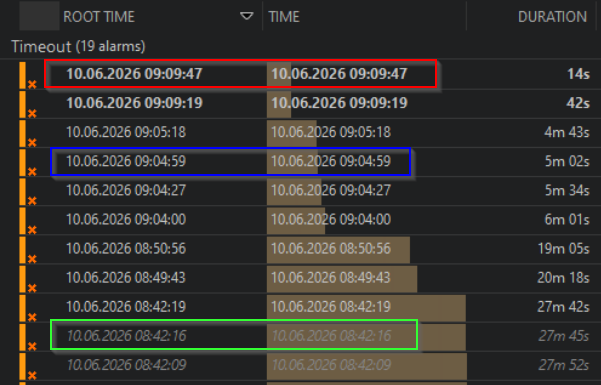
In the screenshot I have three different shades of grey.
The first is a new unread alarm, but what are the two other? Both are old/and read - but different grey
Hi,
The bold white ones (such as in the red box) are indeed new, unread alarms as you mentioned
The white grey ones (such as in the blue box) are read alarms and are the most recent alarm in an alarm tree.
The darker grey, such as in the green box is for alarmevents for which there has been a newer event in the tree (i.e. a change in severity). Meaning these alarms do not reflect the most up to date info.
See this example, you can see the different colours are all part of the same alarm tree (same root alarm). But the older ones have the dark grey colour.
The difference can be useful in custom alarm tabs where "History Tracking" is turned off and alarms are not grouped into their respective trees. This way you still have a visual representation of which alarms are new, current or had updates.
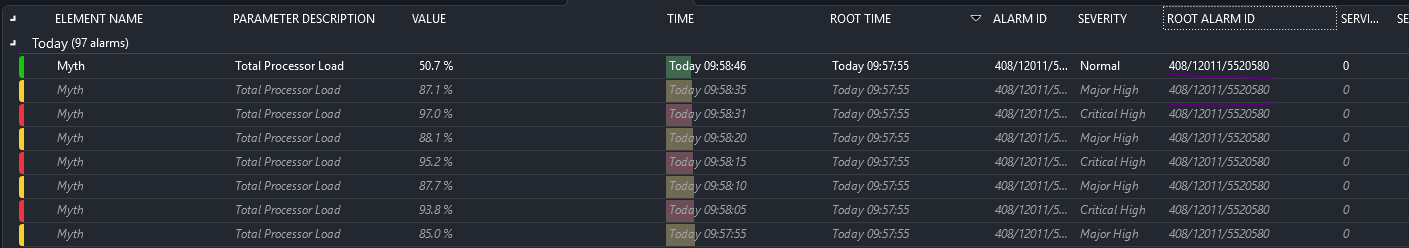
Using the same example, with "history tracking" turned on. It shows the relation a bit better where the dark greys are historic events within a tree.
Hope this clarified the differences a bit
Peculiar. I am unsure how to explain the discrepancy observed. Is this on the Active alarms tab, or on a tab with filters applied (either alarm filter, or the filterbox/severity toggles) which could hide events?
This is observed both in the Active Alarms tab and filtered alarm tabs.
Thank you Brent for explaining
We have "Histroy Tracking" turned on, but the first line in the alarm tree has that darker and italic text (as in the green box) for some of the alarms. It is not clear from my screenshot, but all the alarms were from different elements.