We have parameters from two elements being joined together by trend parameters based on Trend Start time. We are getting some results back, however, not all the results we were expecting. I am thinking this might be due to the trend time and readings not exactly matching. Is there a better way to perform this correlation and display the results in a chart?
Our configuration is:
Element 1 is an antenna rotator, which is set to rotate twice a day from 0 to 360 degrees with a dwell time of 2 minutes. We are trending the angle of the antenna.
Element 2 is a test device collecting RSRP readings for multiple 5G channels, trending the RSRP reading.
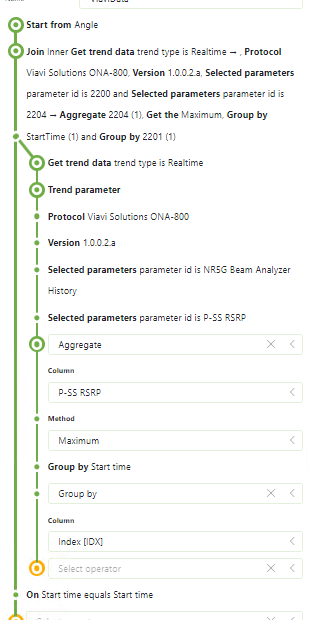
The Dashboard configuration then uses the Table Join function on trend start time to correlate the angle and the Max RSRP readings into chart parameters. This does provide some results, but not all the results we expected when compared to adding the trend lines together on a trend report rather than as a dashboard chart. We expected to have a Max RSRP reading for each Angle charted, however, we are only seeing a subset in the results.
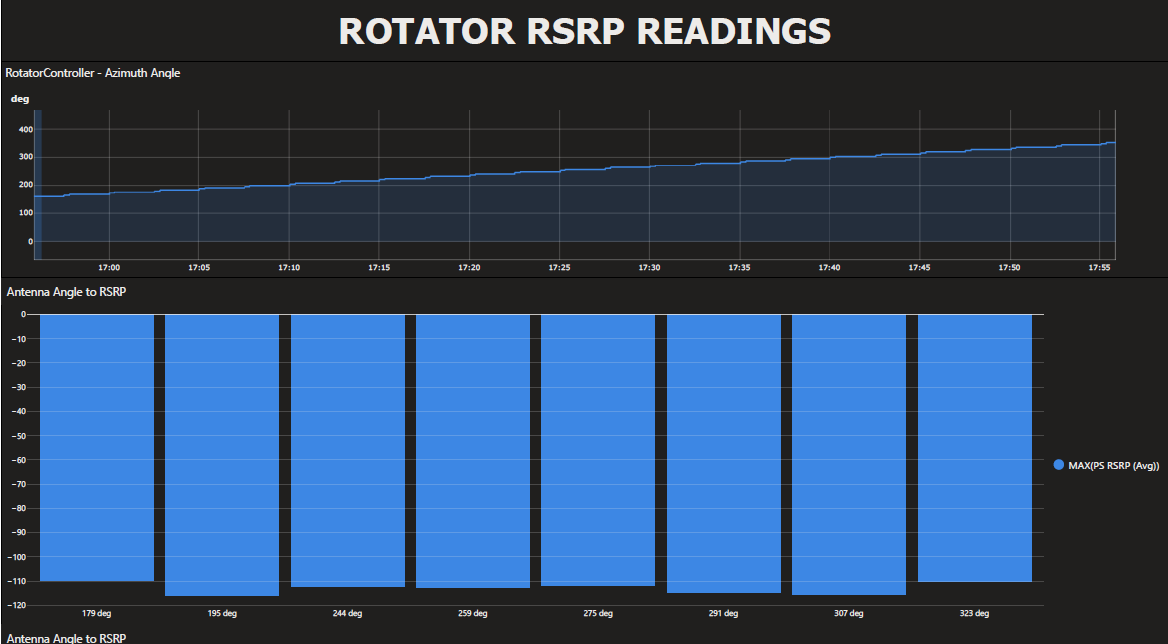
Following is one example of the results we are receiving. The top trend is the Antenna Rotator angle stepping 8 degrees at a time up to 360 degrees, with 2 minutes between each step. While the chart below shows the RSRP level readings. We expected a RSRP reading for each antenna location (every 8 degrees) not just 8 readings total in this example. Other timeframes have had more or less readings charted but have yet to see one with a reading for each angle represented as expected.
Hi Steve,
From what you explained I think your suspicion is correct that it’s likely the start timestamps do not match exactly.
To investigate this further and to solve this issue you could use the experimental Custom Operator feature of GQI (currently in softlaunch).
See: https://docs.dataminer.services/user-guide/Advanced_Modules/Dashboards_and_Low_Code_Apps/GQI/Extensions/GQI_Custom_Operator.html
It allows you to transform queried data using a C# script.
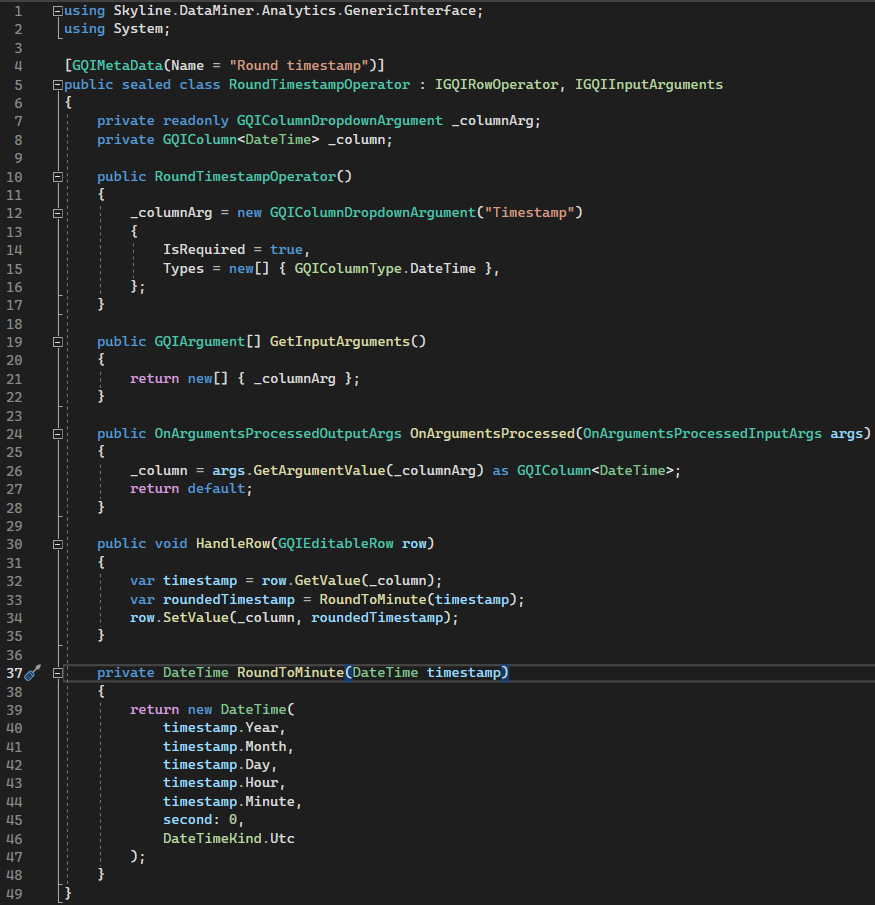
You could use this to e.g. to round timestamps to the nearest minute.
Example
Code:
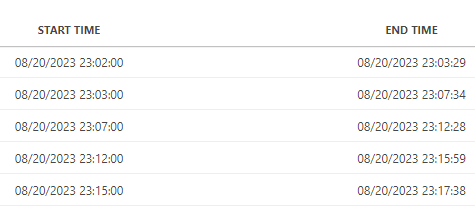
Usage:
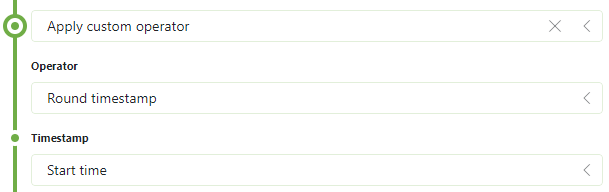
Result:
Thanks Matthijs! You could indeed also use this existing operator since join and group operators work on the display value of a cell.
Do be careful though with this approach, since the underlying cell values will still have all the precision which might be confusing when using other operators down the line.
Hi Matthijs, How do I get to the GQI to show the ‘Apply Custom Operator’ function? Is there (or can you setup) an example on ZiineDev I can take a look at?
Hi Ronald, Matthijs, thanks for the guidance, I actually found I could perform the same time manipulation using REGEX Match …^[0-9]{2}/[0-9]{2}/[0-9]{4} [0-9]{2}:[0-9]{2}… which looks like is working for me and removes the seconds from the comparison.
Hi Steve, you get the ‘Apply Custom Operator’ when the softlaunch option is enabled (specified here: https://docs.dataminer.services/user-guide/Advanced_Modules/Dashboards_and_Low_Code_Apps/GQI/Extensions/GQI_Custom_Operator.html) AND there is at least 1 custom operator present on your system.
Glad you found a working solution anyways, although I would definitely recommend the Custom Operator approach.
There is already a GQI Operator to format DateTimes, I used this already to ignore minutes and seconds to aggregate by hour, but could be used to aggregate by minutes as well: https://github.com/SkylineCommunications/SLC-GQIOP-Format-DateTime