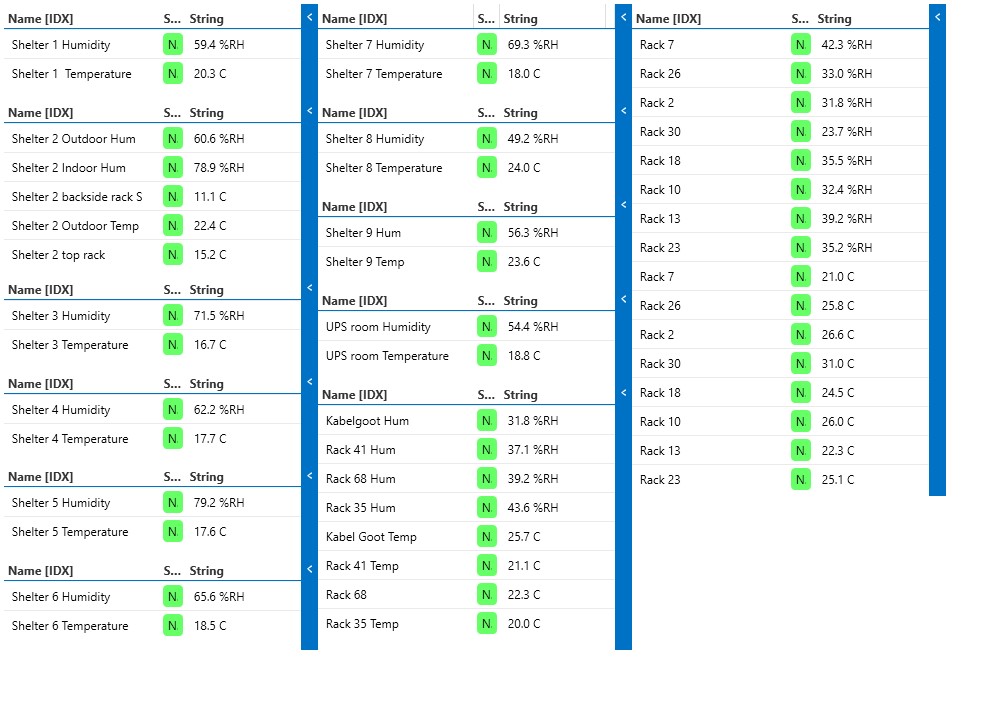
I'm trying to create a summary visual including all our environmental data.
In order to do so i'm adding multiple tables in a visiodrawing but i'm hitting some speedbumps.
- (How) Can i hide the column header of a table?
- (How) Can i hide the "Blue arrowed details thingy ;-)" on the side of the table?
- (How) Can i sort on the sensors names in the "Name [IDX]" column? (tried Sort without success)
Marieke Goethals [SLC] [DevOps Catalyst] Selected answer as best
As this question has now been inactive for a very long time, I will close it. If you still want more information about this, could you post a new question?
Hi Jurgen,
Not a Visio related answer but if the different tables in your Visio are coming from different elements using the same protocol, you can consolidate all this information and have them in one table in a Dashboard using a GQI query. Hope it helps.
Wale Oguntoyinbo [SLC] [DevOps Advocate] Answered question
I see that this question has been inactive for some time. Do you still need help with this? If not, could you select the answer that has been most helpful for you (using the ✓ icon)?