Good afternoon Everyone.
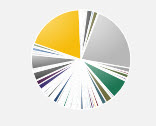
In a Piechart Visio shape I would like to display my top 5 talkers with regards to Task CPU consumption for example, instead of showing all tasks which has way too many slices to make sense of. How would I achieve this if possible.

At the moment I have tried variations of the following:
ParametersOptions = PIECHART|Sort:Desc|MaxItems:5 / PIECHART|SortOrder:Desc|MaxSlices:5
As far as I can tell, adding a limit or "top x" to a pie chart in Visual Overview is not a supported feature.
As an alternative, I'd like to point you to the pie chart from our web visualization. You can also embed that component directly in your Visual Overview with a Link shape.