Hi Community.
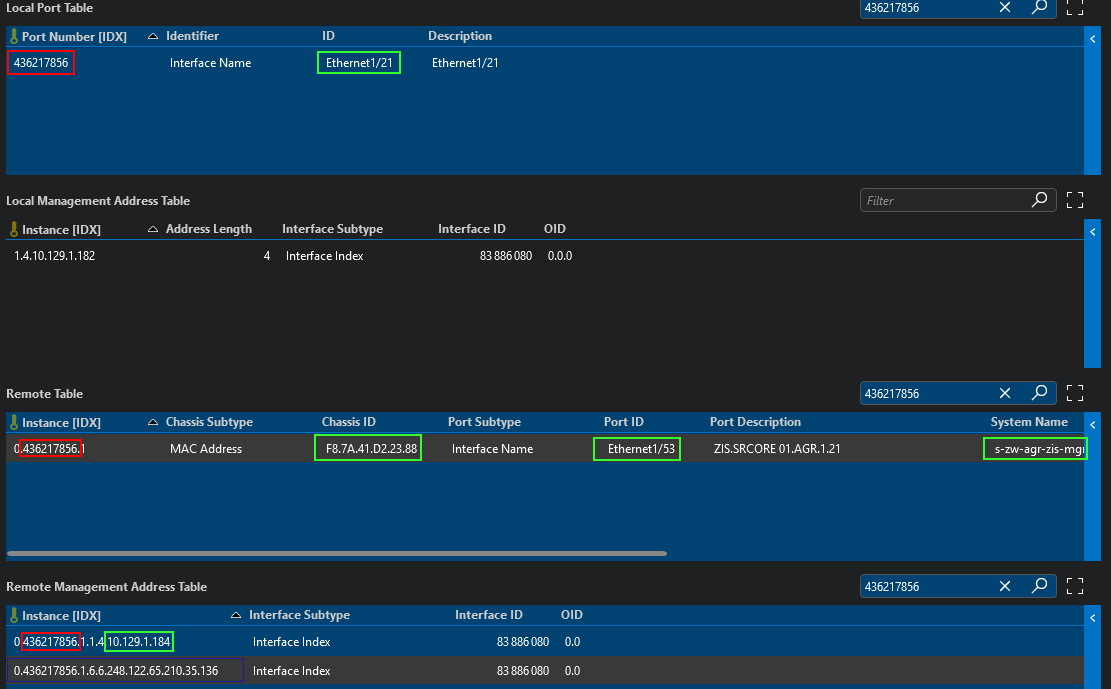
We would like to create a custom table on a visual, that shows data from multiple tables of the same element in a row each. The data has common IDX in all participating tables. The IDX is marked in red below, the data to be linked in the new table in green.

How would the shape data have to look like, to combine these values in a new table?
Many thanks and best regards
André
Not sure if this would be a solution for your use case, but to combine data from different tables and sources in DataMiner, GQI in Dashboards are your best friend. Configuring query (GQI) data feeds | DataMiner Docs. Not sure how important it is to display that data table in your Visual Overview (because GQI is currently only available in Dashboards - but of course you could add a button in Visual Overview to launch the dashboard with the new table you made, or you could embed the dashboard maybe).