Hello Dojo,
We are creating a dashboard to display 4 parameters of the same upstream table (CM Total, CM Online, CM Offline, CM Init) of CMTS Devices in one dashbaord. We created the following:
But We have a lot of interfaces (350) per Device to display, so we want to know if there a way to filter the interfaces in this dashboard or do another dashboard that display multiple graphs like the image.
Best,
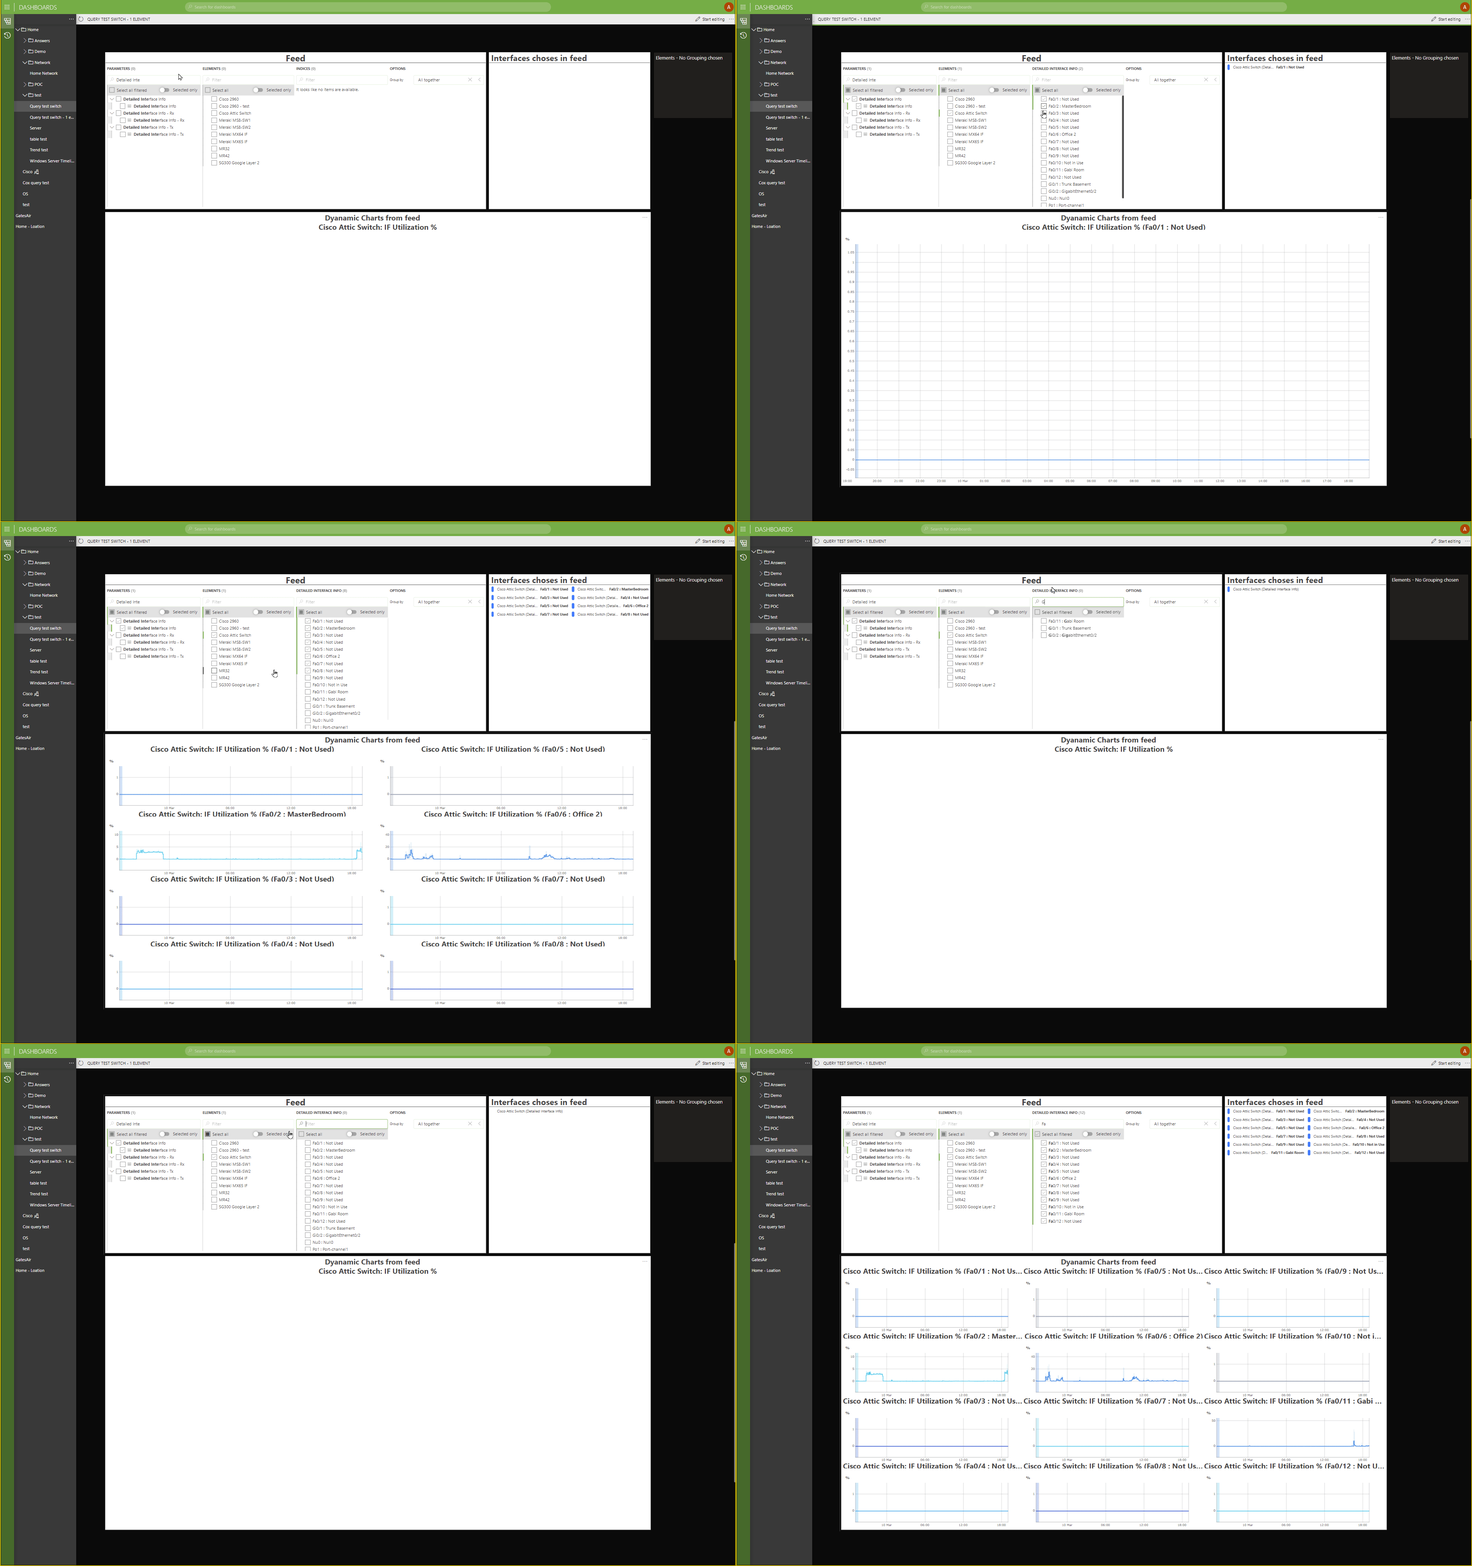
One option would be to use a Feed. The feed can be used to filter the interface by the indices of the device table. Check the boxes you want to you want to display.
This is a very dynamic option. You can filter on elements. Then you can filter on the interface indices. Lets say you just want to filter on 3 specific interfaces then check the boxes. If you can do so or if you want to filter on 100 interfaces you can do it with the same feed. You can take advantage of the filter on only the indices you want to use for you selections.
In this example I have a feed for the Cisco Manager protocol
1) I choose the detailed port interface table
2) I choose a specific Cisco element (Device)
3) All the interfaces are displayed
– I can select all
– I can select individual interfaces
– I can filter on Gigibit name interfaces (type Gi)
– I can filter on the FastEthernet ports in the name by typing Fa

Hi Ricaurte. Take a look in you dashboard to see if the Parameter Feed is available. I will look to see when it was available. To get this feed option it also may need a softlaunch attribute turned on. I will check
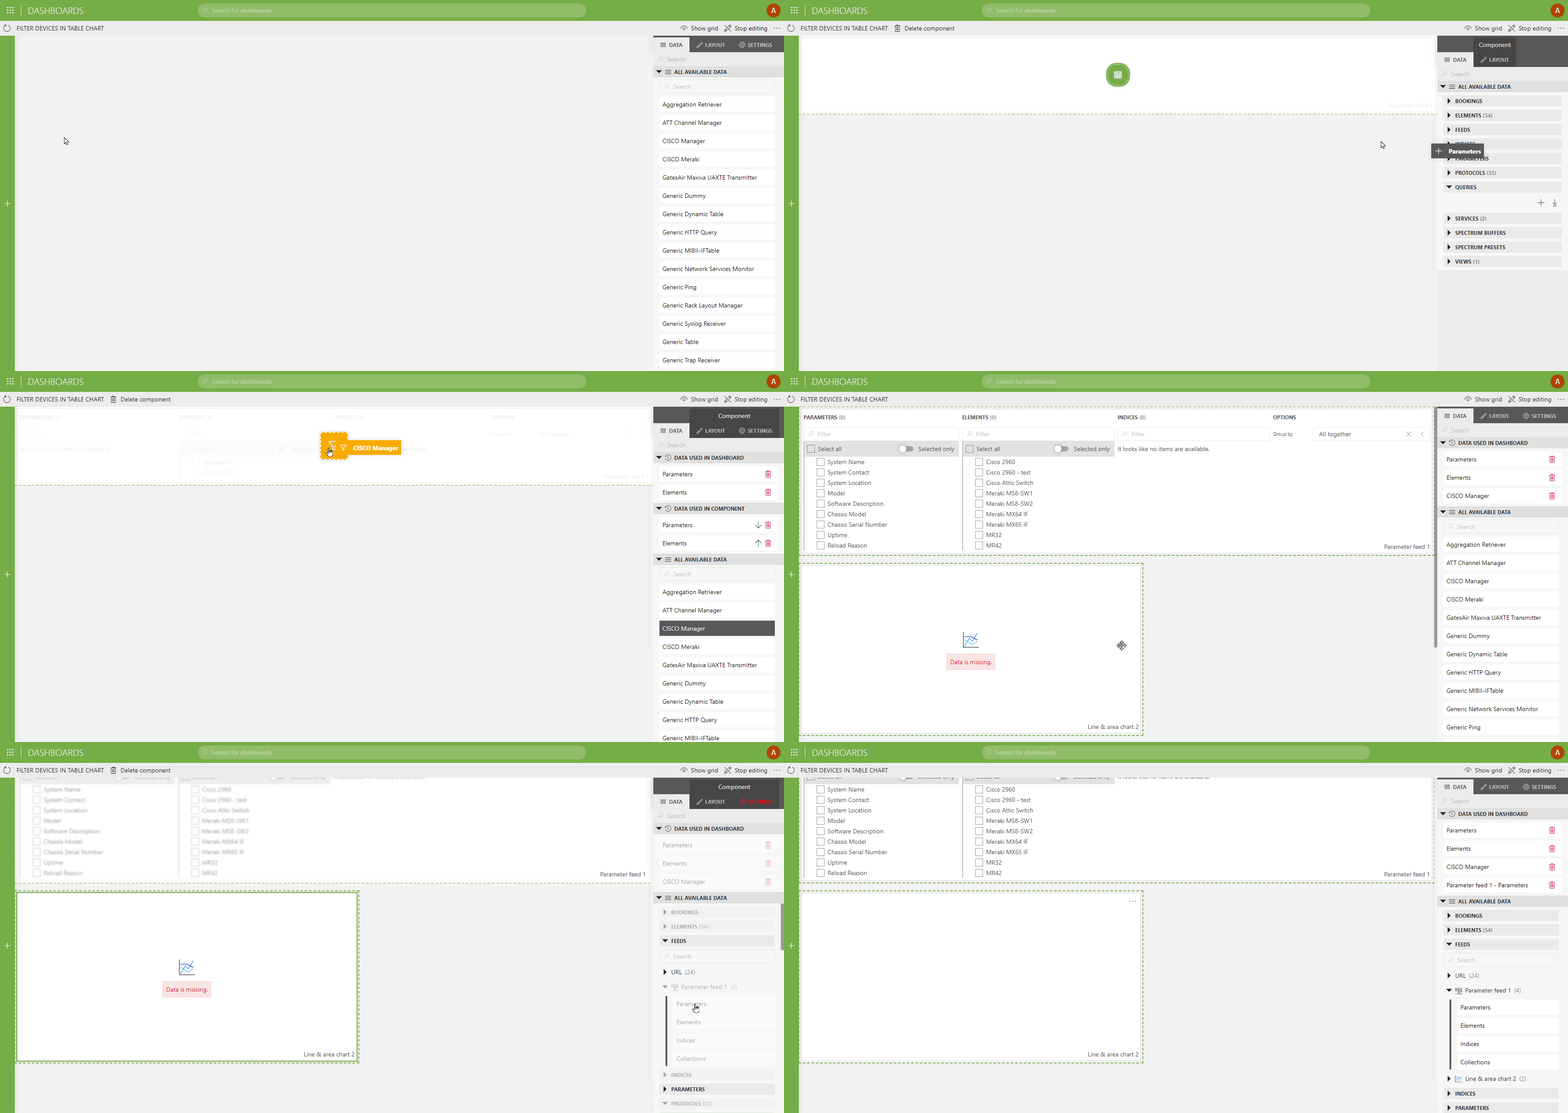
I believe the feed is available. It is the Parameter Feed.
- Add Parameters
- Add Elements
- Add the specific Protocol as a filter to the component. I also had added a view as a filter too reduce the number of Cisco switch elements.
- Add a graph component.
- Select this Feed component -> parameters to the graph component.
- In the Feed. I chose Group By: All Together
- In the Graph component -> Settings: No Grouping
- In the graph component -> I changed the columns to 3 and you may need to change the rows.

Thanks for the info, We already create the dashboard.
Best.
You may need to enable these two softlaunch option. The following link explains which file to make the change. Remember, softlaunch features are new features that are being tested and not yet included in official Dataminer releases.
Adding a softlaunch requires a restart. Save the old working softlaunch file as backup if you are already have softlaunch features enabled. If you have some typos in this file the cube may not start. This way you can alway revert back to a working softlaunch file.
ReportsAndDashboardsAlpha
Enables alpha components in the new Dashboards app.
Minimum version: 9.6.6
ReportsAndDashboardsPTP
Enables the Query Filter component in the new Dashboards app.
Prior to DataMiner 10.0.13, this option also enables the Generic Interface feature in the Dashboards app, which becomes available from 10.0.13 onwards (partially using the GenericInterface soft-launch option).
Prior to DataMiner 10.1.5, this option also enables the Node Edge component, which becomes available by default from DataMiner 10.1.5 onwards.
Minimum version: 10.0.4
Hello Randy,
Thanks for the info, I’m looking for this option, but I don’t see the feed option in the available data
Do you know if this option is available in this Dataminer version 10.0.1947.10090-fbd6728f?