Skip to content
DataMiner DoJo

More results...

Generic selectors
Exact matches only
Search in title
Search in content
Post Type Selectors
Search in posts
Search in pages
Search in posts
Search in pages
Log in
Menu
  • Updates & Insights
  • Questions
  • Learning
    • E-learning Courses
    • Empower Replay: Limited Edition
    • Tutorials
    • Open Classroom Training
    • Agility
      • Kanban workshop
      • Agile Fundamentals
    • Certification
      • DataMiner Fundamentals
      • DataMiner Configurator
      • DataMiner Automation
      • Scripts & Connectors Developer: HTTP Basics
      • Scripts & Connectors Developer: SNMP Basics
      • Visual Overview – Level 1
      • Verify a certificate
    • Video Library
    • Books We Like
    • >> Go to DataMiner Docs
  • Expert Center
    • Solutions & Use Cases
      • Solutions
      • Use Case Library
    • Markets & Industries
      • Media production
      • Government & defense
      • Content distribution
      • Service providers
      • OSS/BSS
    • Agile
      • Agile Webspace
      • Everything Agile
        • The Agile Manifesto
        • Best Practices
        • Retro Recipes
      • Methodologies
        • The Scrum Framework
        • Kanban
        • Extreme Programming
      • Roles
        • The Product Owner
        • The Agile Coach
        • The Quality & UX Coach (QX)
    • DataMiner DevOps Professional Program
      • About the DevOps Program
      • DataMiner DevOps Support
  • Downloads
  • More
    • Feature Suggestions
    • Climb the leaderboard!
    • Swag Shop
    • Contact
    • Global Feedback Survey
  • Support
  • PARTNERS
    • All Partners
    • Technology Partners
    • Strategic Partner Program
    • Solutions
    • Deal Registration
  • >> Go to dataminer.services

Trend average value

Solved1.37K views27th September 2024
0
Stefan Schedletzky [DevOps Enabler]2.06K 9th October 2023 2 Comments

Dear Dojo,

is it possible to show a parameter average value? For example I have a interface utilization like this:

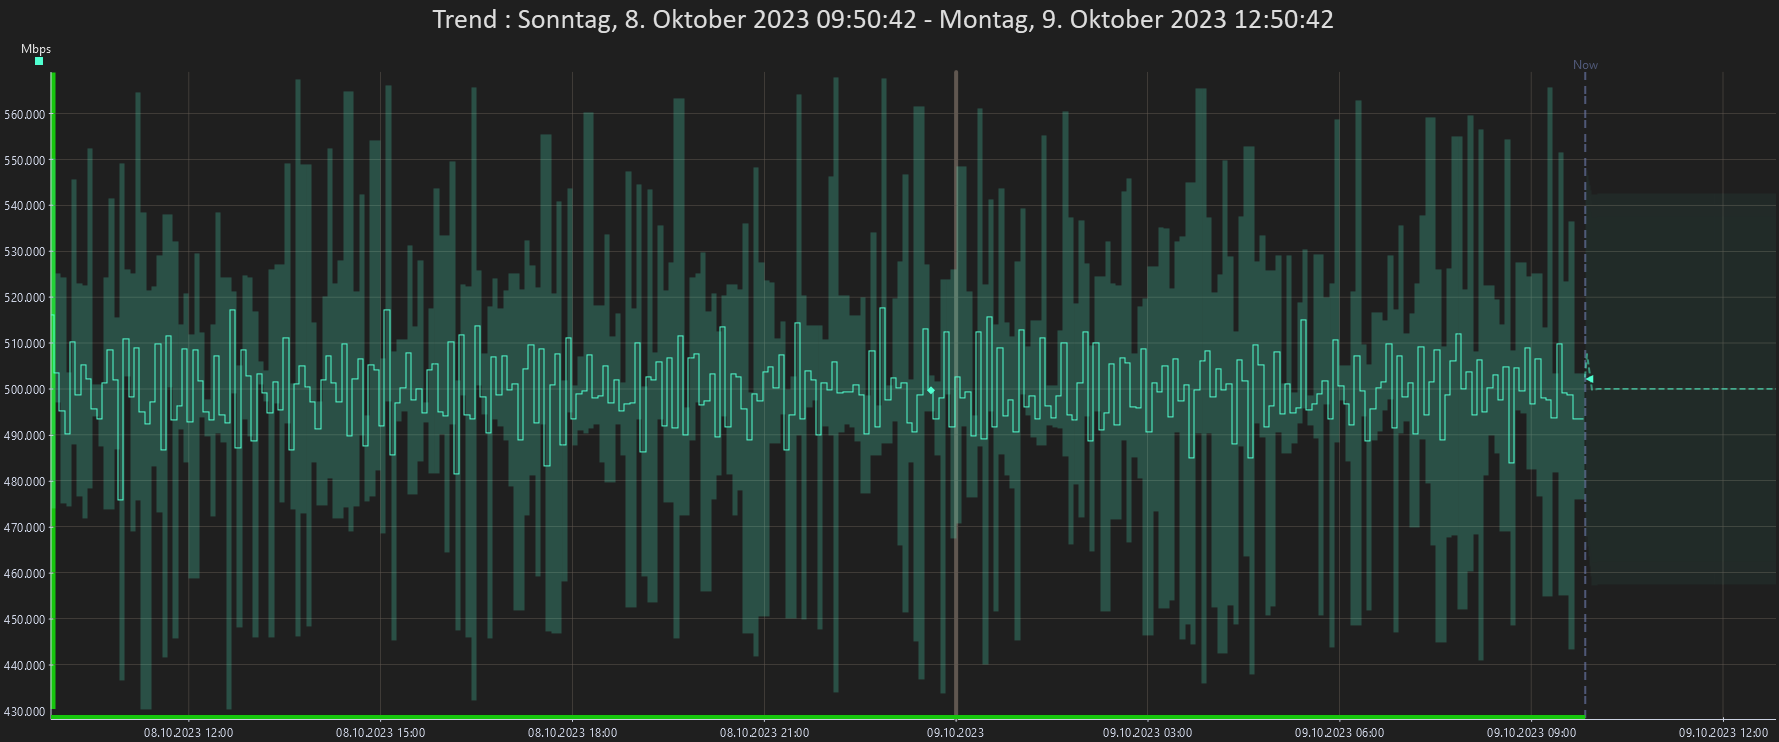
It's going up and down over 50 Mbps which is fine. For our Visio drawing we would like to have the value of the center line.

Marieke Goethals [SLC] [DevOps Catalyst] Selected answer as best 27th September 2024
Marieke Goethals [SLC] [DevOps Catalyst] commented 23rd August 2024

Hi Stefan,
I see that this question has been inactive for a long time. Do you still need more information about this? If not, could you select the most relevant answer to indicate that no further action is needed here?

Marieke Goethals [SLC] [DevOps Catalyst] commented 27th September 2024

As this question has now been inactive for a long time, I will close it. If you still want more information, could you post a new question?

2 Answers

  • Active
  • Voted
  • Newest
  • Oldest
0
Toon Casteele [SLC] [DevOps Enabler]7.03K Posted 9th October 2023 0 Comments

You can access the trend statistics (and among others the average median) overlayed on the graph by right clicking on the graph and clicking "trend statistics...".

Alternatively, you can use the percentile line in the same way on that graph itself.

Toon Casteele [SLC] [DevOps Enabler] Answered question 9th October 2023
You are viewing 1 out of 2 answers, click here to view all answers.
Please login to be able to comment or post an answer.

My DevOps rank

DevOps Members get more insights on their profile page.

My user earnings

0 Dojo credits

Spend your credits in our swag shop.

0 Reputation points

Boost your reputation, climb the leaderboard.

Promo banner DataMiner DevOps Professiona Program
DataMiner Integration Studio (DIS)
Empower Katas
Privacy Policy • Terms & Conditions • Contact

© 2025 Skyline Communications. All rights reserved.

DOJO Q&A widget

Can't find what you need?

? Explore the Q&A DataMiner Docs

[ Placeholder content for popup link ] WordPress Download Manager - Best Download Management Plugin